

AI vs Wall Street #2: Inflection Point candidates from Earnings Week 3-7 November.
with update on the stock candidates performance since AI vs Wall ST #1


I published the first AI vs Wall St series on November 3rd, profiling stock idea candidates identified solely by AI using our Professional Context-Aware Smart Screen (available to paid subscribers). The short-listed candidates from that week, were focused on Turnaround and Reversal ideas and, like the ideas that follow, are identified by AI that is supplied with an operationalized investment process similar to that used in the hedge fund I co-founded, that considers both quantitative (structured) and qualitative (unstructured) data. While quantitative data alone is typically static and backward looking, unstructured data (management commentary, guidance and sentiment changes) are more forward looking, providing an opportunity to consider a complete range of signals much as a human analyst would, only across a far larger universe than any analyst can cover themselves.
I am tracking the performance of all the AI vs Wall St ideas as a test of the capabilities of AI in stock picking. As the title says - this is pitting AI vs Wall St. Here’s the performance update followed by AI vs Wall St #2 (earnings week ideas 3-7 November). I present new ideas to free subscribers with a lag, while paid subscribers are able to run these prompts themselves, to research ahead of the pack.
Disclaimer: These are not investment recommendations. Note the disclaimer in the report and on our website. This is an educational product presenting a context-aware approach to initial opportunity screening. In this series I am beta-testing AI’s ability to identify interesting stock situations worthy of further research.
AI vs Wall St Performance Update: 13 November 2025
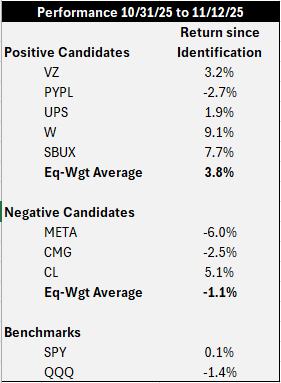
The following returns show stock price performance since the research output was run to close of trade 12 November (8 trading sessions).
Turnaround Candidates: Four out of 5 “positive” stocks are up and have outperformed the market indices with an equal weighted average return of 3.8%, a max of 9.1% and a min of -2.7%.
Reversal Candidates: Three of four negative candidates are down with an average return of -1.1%, with the S&P 500 flat over the same period. The maximum performance is -6% (META) with only Colgate-Palmolive (CL) up 5%.
As a starting point for pitting AI vs Wall St, this represents strong performance with a spread between positive (potential longs) and negative (potential shorts) situations of 4.9% in 8 trading sessions. It is too short a period to conclude on the efficacy of this approach and tracking will continue with additional ideas added and updates provided. However if I was running a pod today, that would represent strong annualized alpha and absolute performance.

AI vs Wall St: Weekly Earnings Season Ideas Monitor (3-7 November 2025)
Potential Opportunities for Further Research
The Inferential Investor Professional Investment Analysis AI Workflows
Report Generation Date: November 9, 2025
Disclaimer: This report shows the response from an AI prompt for research purposes only. The report is an initial and incomplete stock screen, not a complete investment thesis, does not represent financial advice and no recommendation to buy or sell is provided on any security mentioned either by the AI model or by the publisher of this report. The report and ideas are AI generated and AI models can make mistakes. As always, users should verify all information. The prompt and its output are not designed to provide a comprehensive investment idea but act as an initial stock screen. It is indicative and designed to flag interesting situations that individually require detailed further analysis. Investors should not act on the information in this report alone as it is incomplete, unverified and at risk of errors. Do not make investment decisions without professional financial advice. Any investment carries the risk of loss of capital. Past performance is not indicative of the future.
* In this report, “Positive” in relation to a stock refers to situations that AI has identified that reflect a generally positive inflection point in the stock’s fundamental scenario. “Negative” reflects the opposite. Neither represent investment recommendations.
Executive Summary: Inflection Point Candidates
This week’s focus is stocks offering potential inflection points. Distinct from pure turnarounds which require large, long-dated strategic and management / governance pivots, inflection points focus on a wider universe of stocks that have faced slowing (or boom) conditions that show initial signs, from earnings data and management guidance, tone and sentiment of a potential acceleration (positive) or deceleration (negative) that can result in consensus adjustments and drive the stock. These indications, amongst others that include consideration of both quantitative and contextual signals, use AI’s full capabilities to identify potential opportunities that a screening tool never can. This is what we call an “AI Smart Screen” and offer the prompt set within the Inferential Investor’s Professional Prompt Library for investors to run themselves. Our AI vs Wall St idea profiling series, releases these ideas with a lag, while paid subscribers can conduct these screens in real time.
The 7-day review period (November 2-9, 2025) captured a peak week of the Q3 2025 earnings season, with 91% of S&P 500 companies having now reported.1 The headline results are strong, with 82% of companies reporting a positive EPS surprise and 77% reporting a positive revenue surprise.1 This has contributed to a blended Q3 earnings growth rate of 13.1%, marking the fourth consecutive quarter of double-digit earnings growth for the index.1 This fundamental strength, however, has pushed market valuations to elevated levels. The S&P 500’s forward 12-month P/E ratio now stands at 22.7, significantly above both the 5-year average (20.0) and the 10-year average (18.6).1 This expensive backdrop creates a high bar for performance, where consensus beats are met with muted reactions 2 and any miss—particularly on forward guidance—is severely punished.
Several key themes emerged this week. Artificial Intelligence continues to be a primary driver, propelling results at software and chip companies like Palantir (PLTR) and AMD.3 A significant second-order effect of this trend is the surging demand for clean, reliable power for data centers, which has been a major tailwind for utilities.5 Bellwether reports this week provided critical inflection signals. Super Micro Computer (SMCI) delivered a catastrophic revenue and margin miss, signaling a major air pocket or competitive disruption in the AI server market.7 Uber (UBER) missed operating income and guided Q4 EBITDA below consensus, raising near-term margin concerns.8 Conversely, Pfizer (PFE) provided a strong “beat and raise” driven by its non-COVID portfolio, suggesting a fundamental bottoming for the pharma giant.9
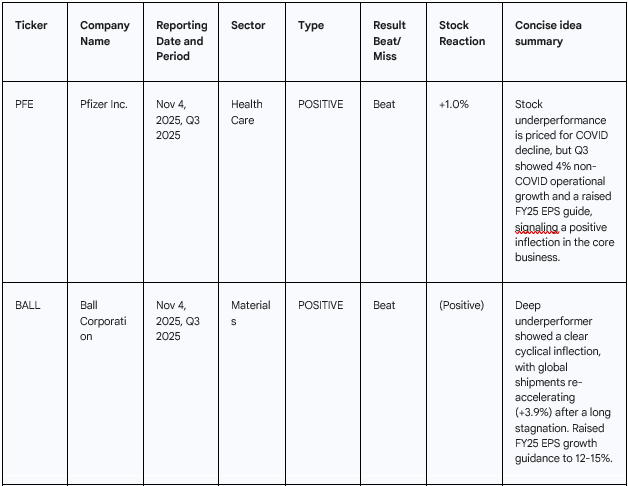
This screen identified eight compelling inflection point candidates. The five POSITIVE candidates (PFE, BALL, RIVN, AMGN, VRTX) are primarily “broken” stocks—deep underperformers that have just posted tangible, fundamental proof of a positive inflection. These signals include Pfizer’s non-COVID re-acceleration 9, Ball Corp’s return to volume growth 10, and Rivian’s first TTM positive gross profit.11 These are multi-quarter theses where the market has not yet recognized the turn.
The three NEGATIVE candidates (SMCI, UBER, CEG) represent the inverse: high-flying, consensus-overweight stocks that have just stumbled for the first time. All three have massively outperformed their peers over the past year but just reported results or guidance that missed consensus expectations.8 This “first miss” is often the catalyst for a fundamental re-rating lower, as analysts are forced to cut forward estimates and compress valuation multiples.
Idea Summary Table
* Positive refers to situations that AI has identified that reflect a generally positive inflection point in the stock’s fundamental scenario. Negative reflects the opposite.

Stock Chapters: POSITIVE Candidates
PFE: Pfizer Inc.
● Reporting Date: November 4, 2025 (Q3 2025)
● Sector: Health Care
● Type: Positive
● Result: Beat
Idea Summary:
● Underperformance: Stock is a significant laggard, underperforming the S&P 500 massively in 2023 (-44%) 14 as revenue from COVID products collapsed from $100B in 2022.14
● Inflection Signal: Q3 results showed a 4% operational revenue growth in the non-COVID portfolio 9, demonstrating a stable, growing core business.
● Guidance: Raised and narrowed full-year 2025 Adjusted diluted EPS guidance to $3.00 - $3.15.9
● Tone: Management expressed confidence, “underscoring confidence in our ability to deliver strong results”.9
The investment thesis for Pfizer is a classic “broken stock” inflection. The market has punished PFE for the predictable and dramatic decline in its COVID-related revenues. However, this focus has obscured the emergence of its core, underlying business. The Q3 2025 earnings report provided the first clear evidence that this non-COVID business is stable and re-accelerating. While total revenues showed a 7% operational decline 9, this was better than feared. The key data point, and the catalyst for the inflection, was the 4% operational revenue growth from its non-COVID portfolio.9
This fundamental strength translated directly to the bottom line. The company reported Q3 Adjusted EPS of $0.87 9, decisively beating the consensus estimate of $0.68.15 More importantly, management raised and narrowed its full-year 2025 Adjusted diluted EPS guidance to a range of $3.00 to $3.15.9 CFO David Denton explicitly stated this “underscor[es] confidence in our ability to deliver strong results for our shareholders”.9 The stock, trading at a low 13x P/E multiple 16, has not priced in this turn. Broker targets remain conservative ($30-$32) 17, suggesting ample room for re-rating as consensus estimates rise to meet the new guidance.
Confidence: Medium
Time Horizon: Multi-quarter
BALL: Ball Corporation
● Reporting Date: November 4, 2025 (Q3 2025)
● Sector: Materials
● Type: Positive
● Result: Beat
Idea Summary:
● Underperformance: The stock has been a persistent underperformer, down 4.5% over the last 6 months 19 and 17.5% over the last year 19, lagging the S&P 500.
● Inflection Signal: After a multi-quarter period of flat-to-down volumes, Q3 showed a definitive re-acceleration, with global aluminum packaging shipments increasing 3.9%.10
● Guidance: Management provided a strong signal of this new momentum, guiding for full-year 2025 comparable diluted EPS growth in the range of 12-15%.10
● Tone: “Ball delivered strong third-quarter results... Our solid financial position... drove higher volumes and operating earnings.”.10
Ball Corporation’s Q3 2025 results signal a clear cyclical bottom and growth re-acceleration. The stock has been weak for over a year 19, reflecting a narrative of volume stagnation and macroeconomic headwinds. This quarter’s report directly contradicts that thesis. The most significant data point was the 3.9% increase in global aluminum packaging shipments.10 This represents the first meaningful acceleration in its core business, proving that demand for sustainable aluminum packaging is inflecting positively.
This volume leverage drove strong financial performance. The company reported Q3 2025 comparable diluted EPS of $1.02, a 12.1% increase from $0.91 in the prior-year quarter.10 The inflection is not temporary; management provided new, raised guidance for full-year 2025 comparable diluted EPS growth in the 12-15% range.10 This combination of demonstrated volume re-acceleration (the inflection) and a confident, raised earnings guide (the follow-through) fully satisfies the positive criteria. Analysts have begun to acknowledge this “Bull Case” 21, but the stock’s valuation has not yet caught up to this new, higher-growth trajectory.
Confidence: High
Time Horizon: Multi-quarter
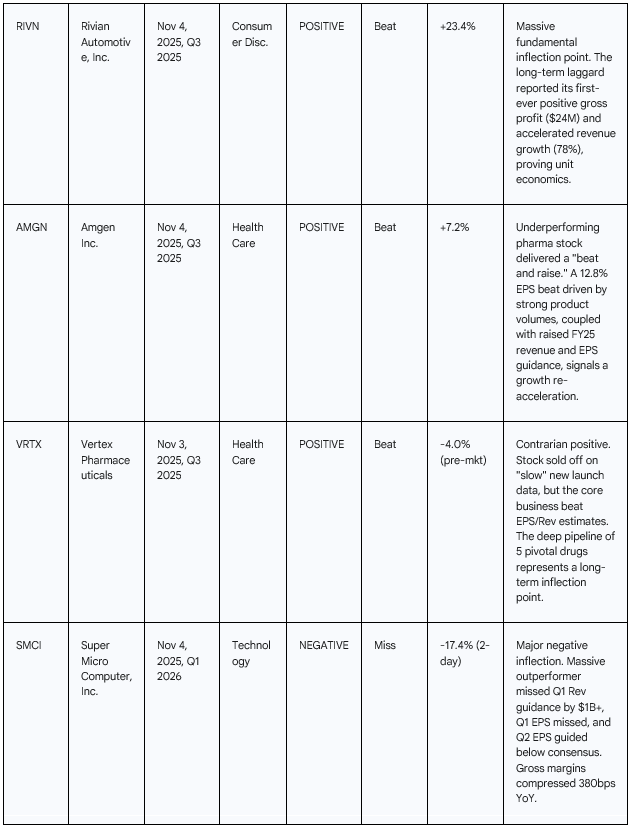
RIVN: Rivian Automotive, Inc.
● Reporting Date: November 4, 2025 (Q3 2025)
● Sector: Consumer Discretionary
● Type: Positive
● Result: Beat
Idea Summary:
● Underperformance: A significant long-term underperformer, with the stock down -0.8% YTD versus the S&P 500’s +16.5% gain.22
● Inflection Signal: The company reported its first rolling twelve months of positive gross profit, posting $24 million for the quarter and $194m TTM.11 This is a critical milestone, moving the story from cash-burn to potential profitability.
● Growth: Revenue growth accelerated sharply, rising 78.2% year-over-year to $1.56 billion 11, beating consensus estimates of $1.46 billion.23
● Market Reaction: The market immediately recognized this inflection, with the stock “ripping higher” by over 23% on the day following the report.11
Rivian’s Q3 2025 earnings represent one of the most significant fundamental inflection points of the week. The narrative for Rivian, and the reason for its persistent stock underperformance 22, has been its massive cash burn and negative unit economics. The primary question has been whether the company could ever build its vehicles profitably. The Q3 report has started to answer that question. For the first time, Rivian generated a positive gross profit for a full trailing twelve month period.11 This milestone demonstrates that the company’s manufacturing model is gradually scaling successfully and unit economics are becoming viable.
This profitability inflection was supported by accelerating growth. Revenue surged 78.2% year-over-year to $1.56 billion 23, handily beating Wall Street estimates of $1.46 billion.23 The bottom line also beat, with a loss per share of $0.70, which was narrower than the expected loss of $0.72 and a significant improvement from the $1.03 loss a year ago.23 While the company still posted a large net loss of $1.17 billion 11 and management maintained its adjusted EBITDA loss guidance for the year 25, the turn to gross profitability is the key forward-looking catalyst. The powerful +23% stock reaction 11 suggests the market sees this as a positive, fundamental change in the business.
Confidence: High
Time Horizon: Multi-quarter
AMGN: Amgen Inc.
● Reporting Date: November 4, 2025 (Q3 2025)
● Sector: Health Care
● Type: Positive
● Result: Beat
Idea Summary:
● Underperformance: The stock has underperformed the S&P 500 over the past six months 26, trading as a low-growth pharma staple.
● Inflection Signal: Delivered a “beat-and-raise” quarter. Q3 Adj. EPS of $5.64 was a 12.8% surprise, beating consensus of $5.00-$5.01.28
● Guidance: Raised full-year 2025 revenue guidance to $35.8B-$36.6B (from $35.0B-$36.0B) and Adj. EPS guidance to $20.60-$21.40 (from $20.20-$21.30).31
● Drivers: The beat was driven by strong volume growth in key products like Evenity, Repatha, and Blincyto.32
Amgen presents an inflection from perceived low-growth to accelerating growth. The stock has lagged the market 26, with investors anticipating a year-over-year decline in earnings for Q3.33 The company’s report firmly reversed this narrative. Amgen reported Q3 2025 adjusted earnings of $5.64 per share, smashing the consensus estimate of $5.00.29 This 12.8% beat was driven by robust underlying business momentum, with strong sales volumes for its key growth products.32
The inflection is confirmed by a confident increase in forward guidance. Management raised its full-year 2025 outlook for both revenue (now $35.8B-$36.6B) and adjusted EPS (now $20.60-$21.40).31 This “beat-and-raise” is the first strong signal in several quarters that Amgen’s growth engine is re-accelerating. The stock, which was trading below $300 before the report, gapped up and closed at $320.20 on November 7.30 This positive market reaction indicates the market is beginning to price in this new, higher growth trajectory.
Confidence: Medium
Time Horizon: Multi-quarter
VRTX: Vertex Pharmaceuticals Incorporated
● Reporting Date: November 3, 2025 (Q3 2025)
● Sector: Health Care
● Type: Positive
● Result: Beat
Idea Summary:
● Underperformance: The stock has been a significant laggard, down -16.8% over the past six months 35, compared to a +22.8% gain for the S&P 500.36
● Core Strength: The core Cystic Fibrosis (CF) franchise remains robust. The company beat Q3 consensus on both EPS ($4.80 actual vs. $4.35-$4.57 est.) and Revenue ($3.08B actual vs. $3.05B est.).37
● Inflection Signal (Thesis): The long-term inflection is the deep pipeline, which management described as “rapidly advancing” with “five... programs in pivotal development”.40
● Opportunity: The stock dropped 4% pre-market 41 because the launch of its new drug Casgevy was “slow” 40 and Alyftrek sales were “lighter than expected”.41 This creates a contrarian opportunity, as the market is overweighting short-term launch noise and ignoring the beat and the long-term pipeline value.
This is a contrarian positive thesis. Vertex is a “broken” stock, with shares down -16.8% in the last six months 35 as investors worry about its dependency on the CF franchise and the viability of its pipeline. The Q3 2025 report showed the core CF business remains strong, beating analyst estimates for both revenue and EPS.37 Sales of Trikafta/Kaftrio were solid.38 However, the stock reacted negatively, falling 4% in pre-market trading.41
This negative reaction is the opportunity. The market focused exclusively on disappointing initial sales from newly launched products, with management noting the Casgevy launch “has been slow” 40 and Alyftrek sales were “lighter”.41 This is short-term noise. The true long-term inflection point, which remains fully intact, is the company’s “rapidly advancing mid to late-stage pipeline”.40 Management confirmed “five of these programs are in pivotal development,” setting the stage for multiple regulatory filings in 2026 and 2027.40 Brokers like UBS reiterated a “Buy” rating post-earnings.42 The thesis is to buy this deep underperformer on a dip caused by short-term sentiment, just as its core business beat expectations and its multi-billion dollar pipeline remains on track.
Confidence: Medium
Time Horizon: Multi-quarter
Stock Chapters: Underperform (Negative) Candidates
SMCI: Super Micro Computer, Inc.
● Reporting Date: November 4, 2025 (Q1 2026)
● Sector: Technology
● Type: Negative
● Result: Miss
Idea Summary:
● Outperformance: A massive outperformer and market leader, stock is up +66.5% YTD 43 on the AI server boom.44
● Inflection Signal: A catastrophic miss on all key metrics. Q1 2026 revenue of $5.0B was down 15.3% YoY 7 and missed consensus of $5.99B 12 and the company’s own prior guidance of $6B-$7B.45
● Deterioration: Gross margin compressed to 9.3% from 13.1% YoY.7 Q1 Adj. EPS of $0.35 missed estimates of $0.40 12 and collapsed from $0.73 YoY.7
● Guidance: Q2 2026 Adj. EPS guidance ($0.46-$0.54) was also well below consensus estimates of $0.61.12
● Market Reaction: Stock collapsed, falling 6.6% on Nov 4 12 and another 11.3% on Nov 5.46 Analysts immediately slashed price targets.12
Super Micro Computer is a clear negative inflection point. This stock has been a primary beneficiary of the AI infrastructure boom, with shares up 66.5% year-to-date 43 and trading on sky-high expectations. The Q1 2026 earnings report on November 4 marked a sudden and severe reversal of this narrative. The company missed its own revenue guidance by over $1 billion, reporting $5.0 billion against a guided range of $6.0B-$7.0B.7 This was not a small miss; it represented a 15.3% year-over-year revenue decline.7
The deterioration was evident across the P&L. Gross margin compressed 380 basis points year-over-year to 9.3% 7, indicating potential pricing pressure or cost issues. Adjusted EPS collapsed to $0.35 from $0.73 in the prior-year quarter 7, missing consensus.12 Management blamed the revenue miss on “Design win upgrades pushed some expected Q1’26 revenue to Q2’26” 45, but this explanation was undermined by their weak Q2 guidance, which also missed consensus estimates.12 The market reaction was violent: the stock fell 6.6% on Tuesday and another 11.3% on Wednesday.12 Analysts at Needham and Mizuho, among others, promptly cut price targets.12 This is a high-flyer that has just hit a wall.
Confidence: High
Time Horizon: Multi-quarter
UBER: Uber Technologies, Inc.
● Reporting Date: November 4, 2025 (Q3 2025)
● Sector: Technology
● Type: Negative
● Result: Miss
Idea Summary:
● Outperformance: Stock has been a strong performer, up +57% YTD 48 and trading near 52-week highs.49
● Inflection Signal: The company missed consensus expectations on profitability and forward guidance for the first time after a period of strong execution.
● Deterioration: Q3 Operating Income of $1.11B was a 31% miss versus the $1.62B consensus.8 Q4 Adjusted EBITDA guidance ($2.41B-$2.51B) was also soft, with the midpoint ($2.46B) below the $2.49B consensus.8
● Tone: Management cited “undisclosed legal and regulatory matters” for the miss 8, introducing new uncertainty.
● Market Reaction: Stock fell 3.9% in pre-market trading 8 and continued to sell off, down 5-7%.50 UBS lowered its price target, citing “near-term margin concerns”.48
Uber’s Q3 2025 report signals a negative inflection in its margin and profitability narrative. The stock has performed very well year-to-date 48, driven by a thesis of accelerating growth and sustained margin expansion. While Q3 top-line growth remained strong (Trips +22%, Gross Bookings +21%) 52, the profitability metrics, which are the focus of the bull case, faltered significantly. The company reported Q3 operating income of $1.11 billion, a massive 31% miss versus the $1.62 billion consensus estimate.8
This miss was compounded by a weak forward-looking guide. Management’s Q4 adjusted EBITDA forecast of $2.41B-$2.51B came in below the $2.49B consensus at the midpoint.8 This is the “first miss” on the key metric that matters to investors. Management’s explanation, citing “undisclosed legal and regulatory matters” 8, adds a new layer of risk and uncertainty to the story. The market reacted as expected to a high-flyer stumbling, with the stock selling off 5-7%.50 Analysts immediately questioned the margin trajectory, with UBS cutting its price target on “near-term margin concerns”.48
Confidence: Medium
Time Horizon: Short-term
CEG: Constellation Energy Corporation
● Reporting Date: November 7, 2025 (Q3 2025)
● Sector: Utilities
● Type: Negative
● Result: Miss
Idea Summary:
● Outperformance: A massive outperformer, with the stock rallying 79.2% in the past six months 53 and 61.4% YTD.55
● Inflection Signal: The stock’s rally has been predicated on the AI / data center power demand thesis.5 Q3 results failed to meet these lofty expectations.
● Deterioration: Q3 EPS of $3.04 missed the analyst consensus estimate of $3.09.13
● Guidance: The company narrowed its FY25 EPS guidance to $9.05-$9.45.56 The midpoint of this new range ($9.25) is below the Zacks Consensus Estimate of $9.44 57, making it a “guide-down” relative to elevated expectations.
● Market Reaction: Stock dropped 3.2% on the news.58
Constellation Energy is a prime candidate for a short-term reversal after a parabolic move. The stock has been one of the market’s strongest performers, rallying 79.2% in six months 53 as the market priced in massive future earnings from AI-driven data center power demand.6 This narrative set an extremely high bar for Q3 earnings. The company failed to clear it.
The negative inflection point was a dual miss on actual results and implied guidance. First, Q3 EPS of $3.04 missed consensus expectations of $3.09.13 Second, while management “narrowed” its full-year guidance to $9.05-$9.45 per share 56, this was interpreted as a negative signal. The midpoint of the new range ($9.25) is below the prevailing consensus estimate of $9.44 per share.57 For a stock priced for perfection, a “meet/miss” quarter that guides below consensus is a significant negative catalyst. The 3.2% stock drop 58 signals that the momentum may be breaking, providing an entry for an underperform position.
Confidence: Medium
Time Horizon: Short-term
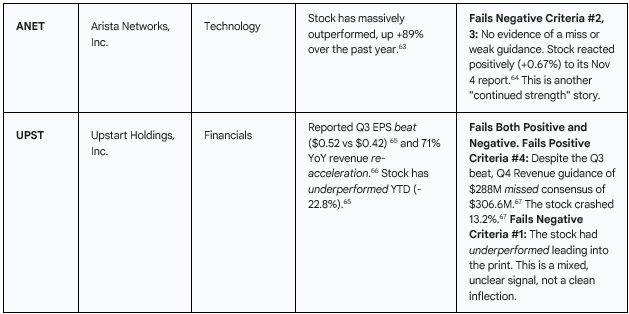
AI Discarded / Lower Ranked Candidates

Single Source Data
All key data points, management comments, and statistics used in this analysis were confirmed across multiple sources, including company press releases, SEC filings, and reputable financial news outlets (e.g., Zacks, Nasdaq, Investing.com, Trefis). No data relied on a single unverified source.
Note that in the initial version of this report the AI model stated Q3 as RIVN's first ever positive gross profit. This was an incorrect interpretation of it being the first ever positive gross profit on a TTM basis. This has been corrected in the live version and is an example where AI models can make mistakes. I note that while, personally RIVN presents as an interesting positive candidate on a 12 month view, this quarter (Q4) presents challenges in lower deliveries and potentially a return to negative GP after demand was pulled forward ahead of the cut to the EV tax credits.The R2 launch in 1H 2026 shapes as the likely positive catalyst for the stock.