

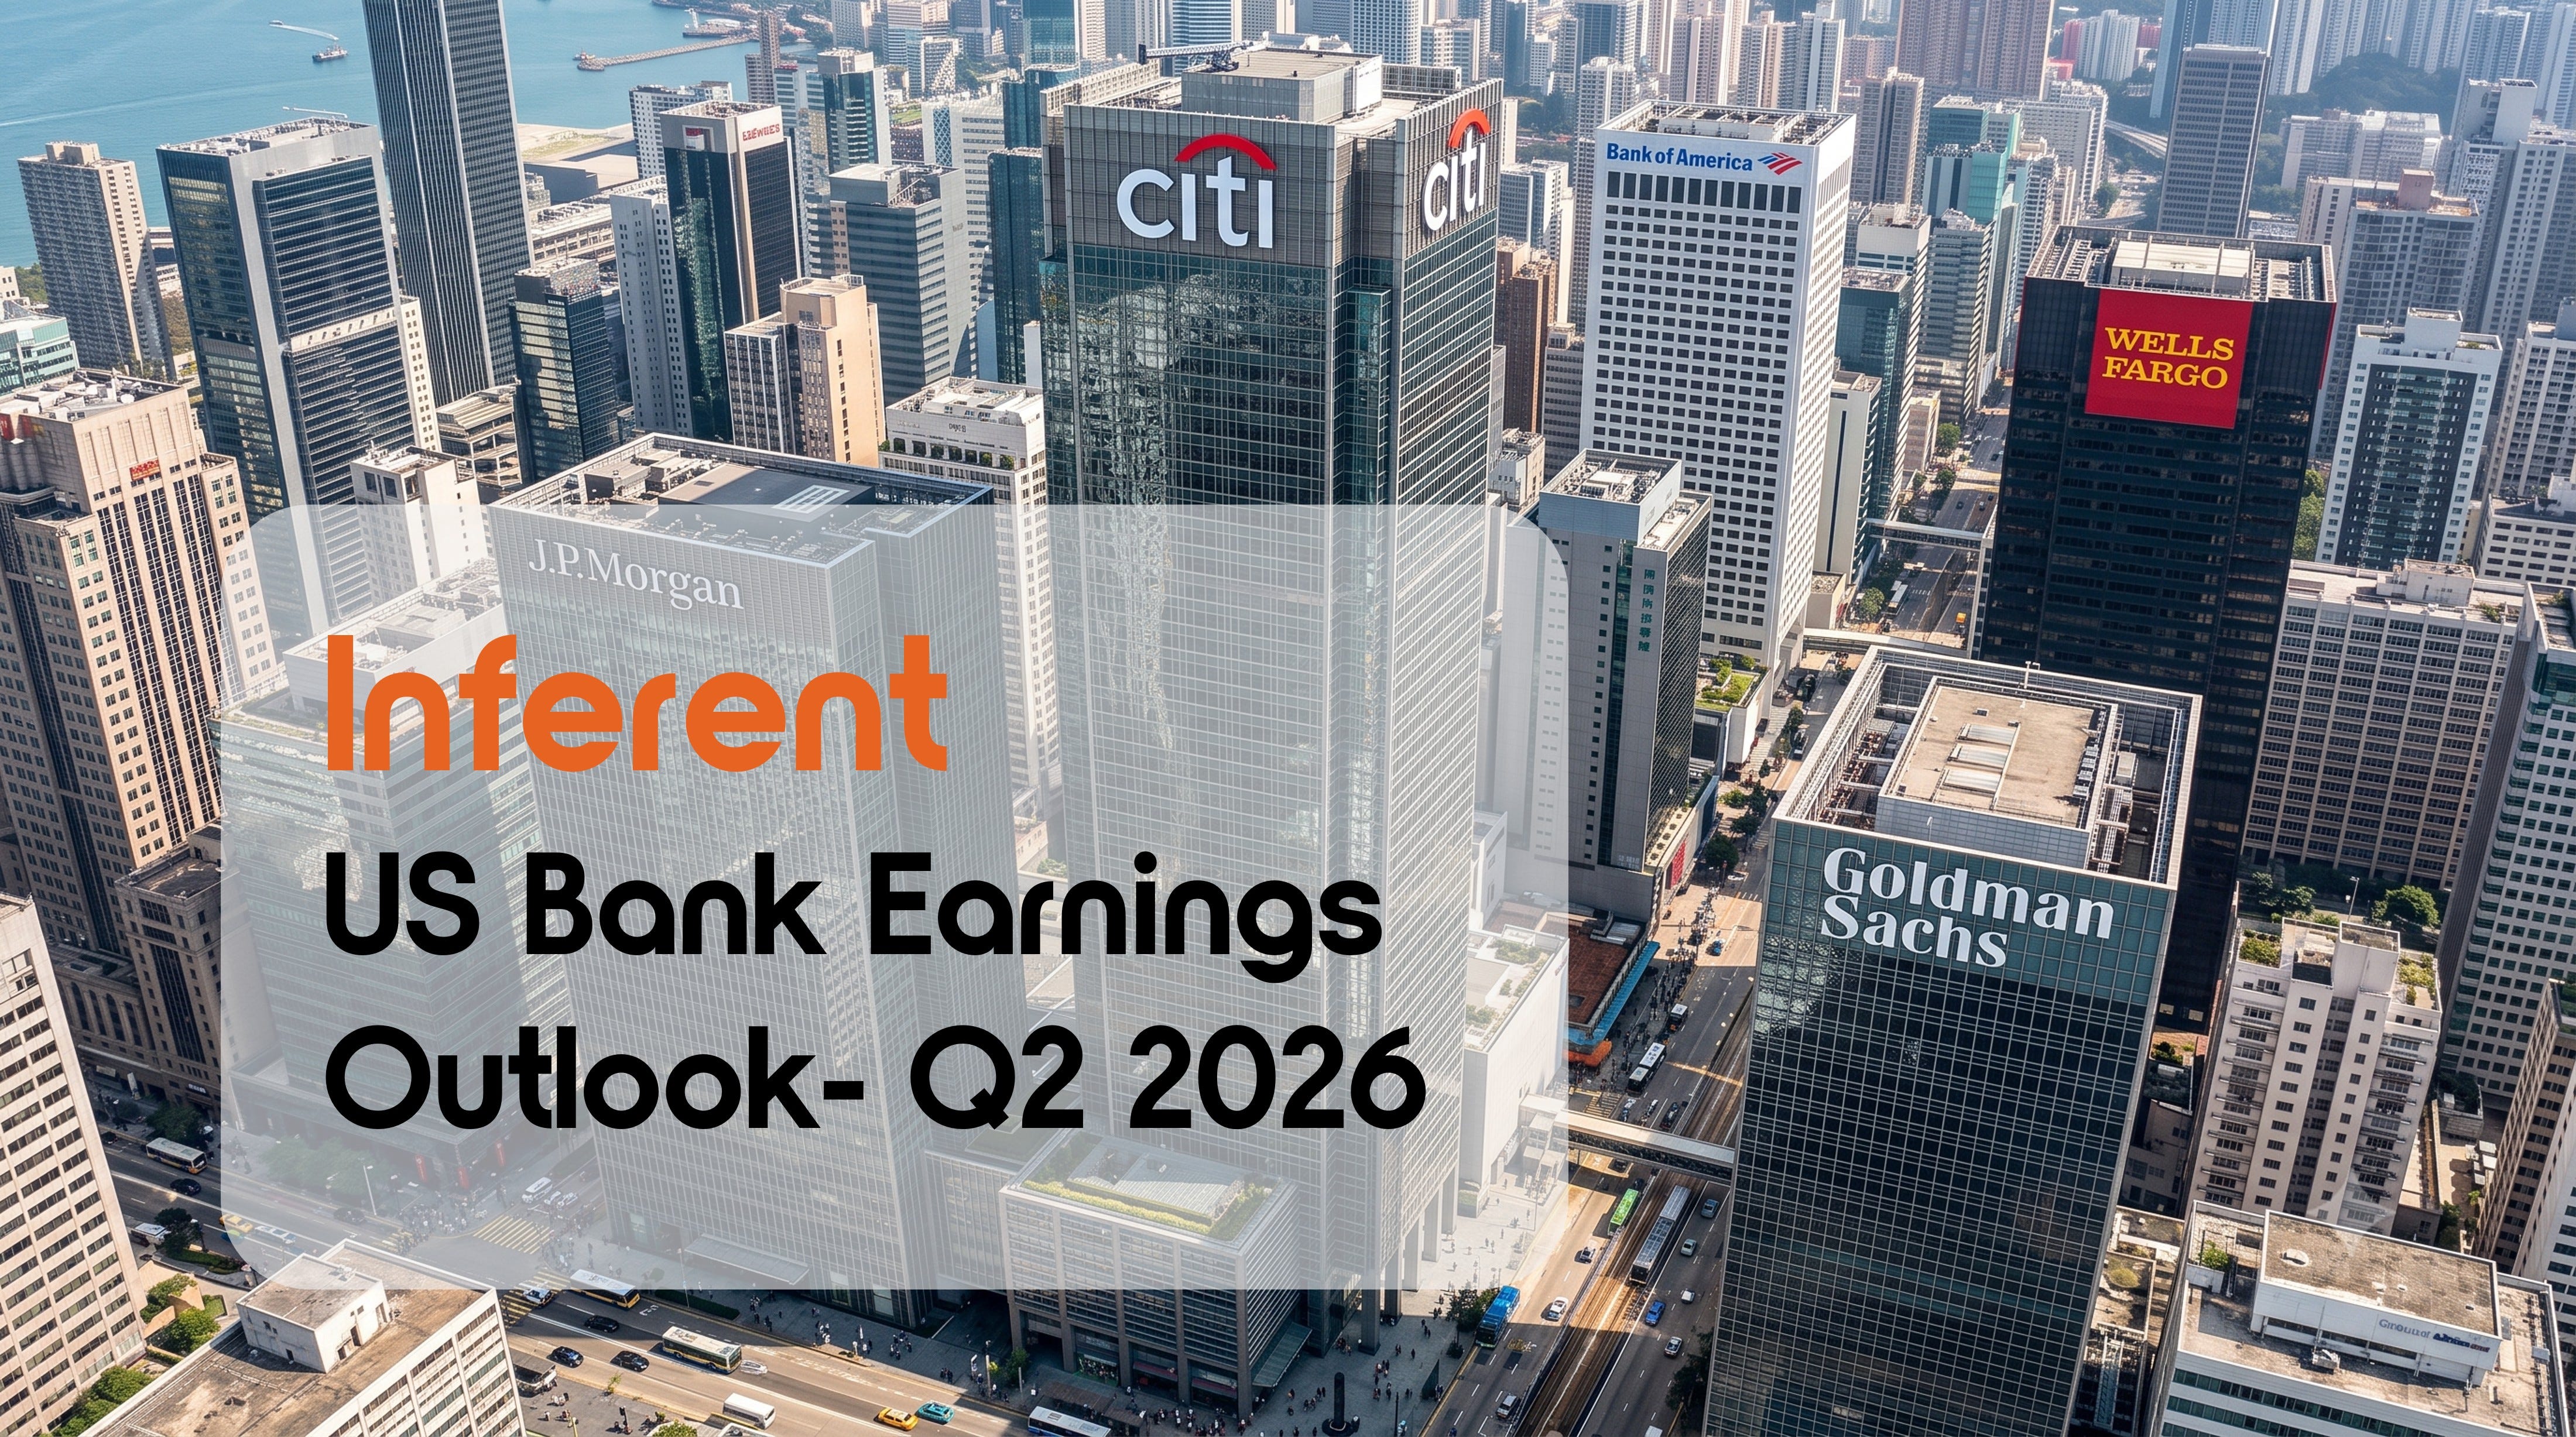
The following report was generated with Inferent Analyst’s agentic intelligence workflows and tools. Subscribe to keep informed of this unique project.
Important Disclaimer: The following stock discussion and analysis is subject to The Inferential Investor’s Disclaimer and any associated disclosures at the end of this report.
The US big banks have delivered a bumper Q2 on the strength of markets and IB dealflow. Core operational strength and capital reinvestment are now evident with a generally upbeat growth outlook
Implications from Q2 2026 US Bank Reporting
Executive Summary
The second quarter 2026 earnings season for the systemically important US megacap banks, JPMorgan Chase (JPM), Goldman Sachs (GS), Bank of America (BAC), Wells Fargo (WFC), Citigroup (C), and Morgan Stanley (MS) represents a critical touch point for financial markets.
Far from showing late cycle fatigue, the largest financial institutions have delivered some of the strongest financial performances in modern banking history.
This reporting cycle was defined by record breaking investment banking and equities trading results, exceptionally stable credit metrics, and a notable shift in corporate strategy.
Instead of focusing on defensive risk posture or near term Return on Tangible Common Equity (ROTCE) optimization, management teams are increasingly leveraging their massive outperformance to aggressively fund multiyear growth, digital transformation, and capital reinvestment programs.
The overall message is that the US banking giants are capitalizing on a robust, AI driven macroeconomic backdrop while preparing for a more stabilized regulatory regime, establishing a highly resilient and structurally enhanced baseline for future growth.
The report below highlights the common themes and their stock implications from Q2 reporting and outlook statements.
Below that we’ve linked the individual detailed earnings analysis reports for each stock which include the financial results and analysis of the earnings calls where available.
These resorts are produced agentically using Inferent Analyst workflows. You can pre-register below to access what is designed to be a fully agentic assistant analyst experience complete with data terminal and integrated financial data interpretation and insights.
Let me introduce you to Inferent Analyst - a cutting edge investment research platform being developed by investors - for investors. Inferent Analyst is designed to be every investor’s autonomous equity research assistant. No more pages and pages of raw numbers without context like traditional data terminals. Inferent Analyst actually interprets and analyzes the data automatically, as events unfold, presenting you with the insights you need to discover ideas and make better investment decisions. Pre-register today as subscriber seats will be limited on launch.

Common Themes in Recent Performance
The stellar financial results observed in Q2 2026 were driven by three pillars of growth across all the institutions:
1. Capital Markets and Investment Banking Resurgence
After several quarters of muted activity, corporate finance and trading engines fired on all cylinders. This quarter benefited from a massive, synchronized resurgence in advisory, equity underwriting, and debt capital markets. Goldman Sachs and JPMorgan Chase led the charge with record quarters in Global Banking and Markets. Goldman Sachs posted a massive 53% year over year surge in Global Banking and Markets revenue, while JPMorgan delivered a similarly eye catching 86% year over year increase in Equity Markets revenue, alongside a 30% jump in investment banking fees.
Even the traditionally commercially focused institutions achieved historic capital markets milestones. Bank of America posted a 33% year over year rise in sales and trading alongside a 50% increase in investment banking fees. Wells Fargo, with its record investment banking fees, crossed the $900 million mark, and Citigroup, with an investment banking revenue surge of 44%, was backed by high profile roles in major IPOs.
2. Consumer Resilience and Credit Quality Stability
A secondary driver of the clean earnings beats was the better than modeled credit performance across the consumer and corporate sectors. Goldman Sachs, with credit provisions falling 73% year over year, reached just $102 million. At Wells Fargo, net credit charge offs fell 10 basis points year over year to an annualized 0.34%, with delinquencies continually trending better than internal models.
JPMorgan, with its credit metrics remaining exceptionally solid, prompted a downward revision of its card net charge off rate guidance to approximately 3.2%. Even Citigroup, which has faced credit headwinds in its credit card books, maintained card credit loss guidance of 4.0% to 4.5% while highlighting stable overall consumer spend growth of 6% to 7%.
The wealth effect from strong equity markets appears to have offset fears that inflation would impact consumer resilience.
3. Positive Operating Leverage and Efficiency Gains
Record top line expansion enabled banks to demonstrate tremendous operating leverage, keeping efficiency ratios well within long term target zones. Bank of America realized positive operating leverage of roughly 6.6%, pulling its pretax margin up to 36.6%. Wells Fargo decreased its efficiency ratio to 60%, marking its 24th consecutive quarter of headcount reduction. Citigroup significantly beat expectations with an efficiency ratio of 57.4%, as remediation and organizational transformation expenses began structurally stepping down.
Common Themes in Forward Outlooks
While current performance is indisputably strong, earnings call discussions focused heavily on structural themes that will dictate performance into 2027 and beyond:
The AI Infrastructure Buildout and Tech Capex Cycle
AI has transitioned from a theoretical, future efficiency driver to an immediate capital expenditure engine that is actively generating multibillion dollar deals. Leaders at JPM and GS explicitly tied their midterm revenue confidence to this massive wave of technology infrastructure spending.
David Solomon, CEO of Goldman Sachs, outlined that the AI investment cycle is expanding capital needs heavily into energy, infrastructure, and data centers, framing this as the early innings of a highly significant, multiyear buildout. Similarly, Jamie Dimon, CEO of JPMorgan Chase, detailed that overall US capital expenditure is running at roughly $4 trillion annually, with AI related capex skyrocketing from $400 billion to $700 billion year over year, and projected to scale past $1 trillion in the near term. This represents a structural, cyclical tailwind for advisory, equity financing, and debt underwriting.
Moving from Past Margin Optimization to Reinvestment for Growth
A fascinating theme of this cycle is the intentional choice by multiple management teams to reinvest windfall earnings into the business rather than letting them flow directly to bottom line ROTCE. Citigroup became the central case study of this strategy. Despite a highly successful first half with a year to date ROTCE of 13.1%, Citi held its full year ROTCE target at 10% to 11%. CEO Jane Fraser explained that they are playing the long game, using the excess capital and structural expense reductions from wrapping up legacy transformation audits to pull forward 2027 tech investments, including AI, automation, and marketing, into late 2026. This dynamic was echoed at JPMorgan, where expense guidance was raised by $2.5 billion, and at Goldman Sachs, where Solomon noted that capital deployment into the client franchise is always preferred over buybacks when accretive returns are available.
Net Interest Income Stability vs. Margin (NIM) Compression
As the rate environment remains flat or begins to shift, the path of Net Interest Income (NII) remains highly stable, even while Net Interest Margin (NIM) compresses slightly. Underneath this is a deliberate balance sheet mix shift, where institutions are actively growing their lower margin, high volume financing and prime brokerage businesses. This adds highly profitable, absolute NII dollars but compresses the headline NIM percentage. In Wells Fargo’s case, a 4 basis point quarter over quarter compression in NIM to 2.43% triggered initial investor anxiety, but CEO Charlie Scharf vigorously defended this as a deliberate, controlled choice to grow their asset base post asset cap.
Conclusion
The Q2 2026 earnings reporting cycle confirms that the US megacap banks are operating in a highly favorable environment, characterized by resurgent capital markets, extremely clean credit books, and stable deposit dynamics. Rather than maximizing short term earnings, management teams are prudently using this period of strength to aggressively invest in AI, automation, and talent, positioning their institutions for long term competitiveness.
While cyclical peaks in trading and potential macro adjustments are valid watch items, the underlying structural foundations and growth opportunities of these institutions appear to be solid and highly advantaged vs other global banks.
Inferent Bank Earnings Report Links:
Individual Inferent reports break down headline results and segments along with tracking the evolution of management discussion themes, sentiment, identification of key risks and any emerging weak signals…
JP Morgan Q2 FY26 Earnings and Transcript Analysis Report
Goldman Sachs Q2 FY26 Earnings and Transcript Analysis Report
Morgan Stanley Q2 FY26 Earnings Analysis Report
Morgan Stanley Q2 FY26 Earnings Call Report (produced separately)
Wells Fargo Q2 FY26 Earnings and Transcript Analysis Report
Important Disclaimer: This analysis is subject to The Inferential Investor’s Disclaimer. It is for informational and educational purposes only and does not constitute investment advice, a recommendation to buy or sell any security, an offer or solicitation, or a guarantee of future performance. The information is derived from sources believed to be reliable but no representation or warranty is made as to its accuracy or completeness. Any forward looking or scenario descriptions are not forecasts but explorations of the implications of a set of described conditions and are subject to risk and uncertainty. Past performance is not indicative of future results. Readers should consult their own advisers before making any investment decision. This analysis is generated based on a standardized workflow. It has been prepared without taking account of your objectives, financial situation, or needs and does not constitute a recommendation on any security mentioned. You should consider the appropriateness of this information before making any investment decisions. AI can make mistakes.