

Sandisk Corporation (SNDK) Q2 FY26 Earnings Analysis Report
MASSIVE beat and Guidance upgrade: Q3 revenue guide 58% and EPS 200% above consensus. Revenue in Q3 growing at 170% YoY and 52% QoQ.
The following report was generated with the Earnings Analysis Report prompt from the professional prompt library on The INFERENTIAL INVESTOR.
Subscribe to access these tools and stock research.
Important Disclaimer: The following stock discussion and analysis is subject to The Inferential Investor’s Disclaimer. It is indicative, designed to be educational and instructive on advanced techniques for AI in investment research and is not in any respect financial advice or an investment recommendation.
Executive Summary: Sandisk Corporation ($SNDK) - Fiscal Q2 2026 Analysis
One of the standout results of the earnings season.
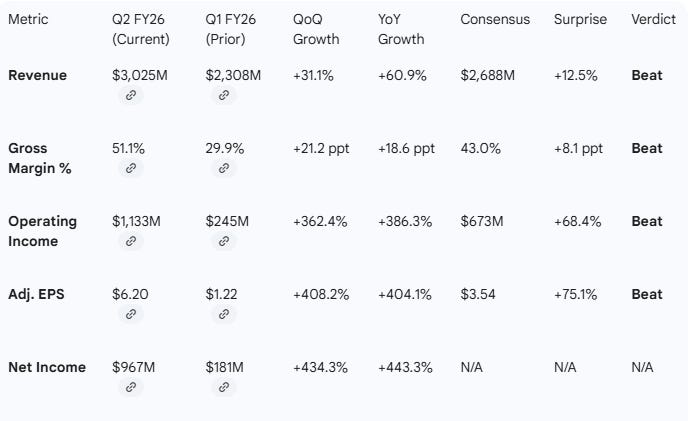
Result: Massive Beat on both revenue (+12.5% vs. consensus) and adjusted EPS (+75.1% vs. consensus).
Revenue: $3.03 billion, exceeding the high end of management’s own prior guidance.
Non-GAAP Gross Margin: 51.1%, an expansion of 21.2 percentage points sequentially.
Adjusted Free Cash Flow: $843 million, up 88% QoQ, driven by strong operational execution and a “structural reset” in supply/demand dynamics.
Growth Momentum: Accelerating. Revenue growth jumped from 23% YoY in Q1 to 61% YoY in Q2 and is forecast to grow by 170% YoY in Q3, fueled by an explosion in Datacenter/AI demand.
MD&A Tone: Bullish and Strategic. Management shifted from “strong execution” (Q1) to “industry-leading performance” (Q2), emphasizing their unique position at the intersection of AI infrastructure growth.
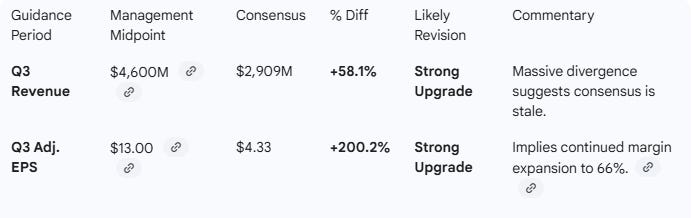
Guidance: Substantially Above Consensus. Q3 revenue guidance midpoint ($4.6B) is 58% above consensus, implying massive upward analyst revisions.
Conclusion: Sandisk has entered a hyper-growth phase. The “Stargate” and BiCS8 product cycles are perfectly timed with a massive AI infrastructure build-out, allowing the company to operate in a high-margin “allocation environment” where demand far outstrips supply.
Performance Highlights and Quantitative Comparison
Performance Summary Table
Key Business Drivers
Datacenter Explosion: Revenue grew 64% QoQ to $440M, driven by AI infrastructure builders.
Pricing Power: Average Selling Price (ASP) per Gigabyte rose by mid-30% in Q2, a massive acceleration from the “mid-single digits” growth in Q1.
Edge Market Allocation: Demand significantly exceeded supply in the Edge market (PCs/Smartphones), forcing the company to prioritize high-margin products.
Inventory Management: Inventories decreased from $2.08B to $1.97B while revenue scaled, indicating high velocity and healthy demand.
Management Discussion & Analysis (MD&A) Comparison
Narrative Summaries
Management Discussion (Current Quarter): Management is highly optimistic, characterizing the current period as the “perfect moment” where their technology portfolio meets market dynamics. The focus is on a “structural reset” to align supply with sustained AI demand, leading to record profitability and industry-leading margins. CEO David Goeckeler emphasized Sandisk’s “agility” in shifting to premium product mixes during an allocation environment.
Management Discussion (Prior Quarter): In Q1, the tone was focused on “strong execution” and “tailwinds” from AI. Management celebrated achieving a net cash position six months early and the early benefits of the BiCS8 technology transition. The emphasis was on stabilizing the business post-separation from Western Digital.
Semantic Comparison & Tone Shift
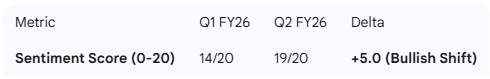
Very large sentiment improvement evident.
Recurring Themes: AI infrastructure, BiCS8 technology, Datacenter growth, separation from WDC.
New Themes: “Allocation environment” (supply shortages), “Stargate” qualification progress, “Structural reset” of the industry.
Tone Shift: The tone has shifted from cautious optimism regarding a recovery to aggressive confidence in a multi-year growth cycle. Q1 focused on “execution” in a “strengthening” market; Q2 claims “industry leadership” in a market where they cannot produce enough to meet demand.
Guidance Evaluation and Consensus Implications
Guidance Table
Guidance Growth Assessment
Next Quarter (Q3) Implied Growth: Guidance of $4.6B revenue represents 52% QoQ growth and over 170% YoY growth (vs Q3’25 revenue of $1,695M).
Full Year (FY26) Implications: Through H1 FY26, Sandisk has generated $5.33B in revenue. If Q3 hits the $4.6B midpoint and Q4 remains flat, FY26 revenue would be $14.5B+, well above the current $11.27B consensus.
Analyst Impact: Analysts will likely be forced to raise FY26 EPS estimates by 50% to 100% to account for the projected 66% gross margins in Q3 and the massive ASP increases.
What is Missing?
FY26 Full-Year Guidance: While Q3 guidance was provided, management has not provided a formal full-year FY26 outlook. Market expectations prior to earnings were looking for more clarity on the sustainability of the “allocation environment” through the end of the year.
Detailed Stargate Revenue Contribution: While management noted Stargate is “advancing through qualification,” there is no specific data on the current revenue contribution or expected volume for CY2026.
Capital Expenditure Detail: While JV Gross CapEx is discussed, the long-term roadmap for capacity expansion to address the current “allocation” shortage is missing. The market likely expects a significant increase in CapEx to capture lost demand, which wasn’t fully detailed.
Disclosure: The publisher of The Inferential Investor holds a position in Sandisk Corp.