

PDD HOLDINGS ($PDD) Earnings Analysis Report
Mixed shopping bag.

The following report was generated with the Earnings Analysis Report prompt from the professional prompt library on The INFERENTIAL INVESTOR.
Subscribe to access these tools and stock research.
PDD Holdings (PDD) Q3 FY25 Earnings Analysis
1. Performance Highlights and Quantitative Comparison
The performance summary below extracts the key financial metrics for Q3 2025 and compares them to the prior quarter (Q2 2025), the same quarter last year (Q3 2024), and the consensus estimates.
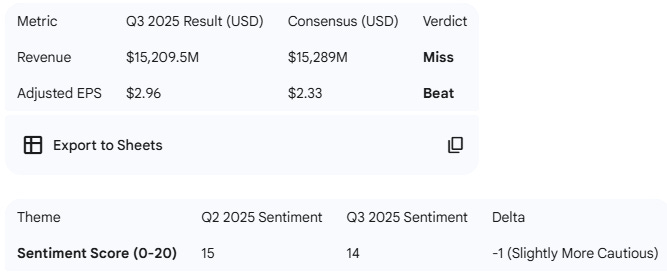
Performance Summary Table (RMB in Millions)
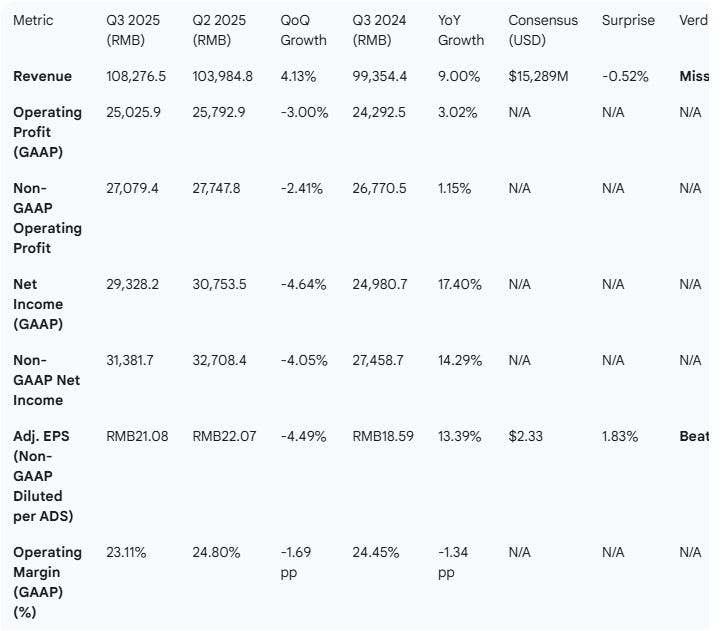
Note: The USD to RMB conversion rate used for Q3 2025 consensus comparison is $RMB7.1190 = US$1.00$ as disclosed in the Q3 2025 press release1.
Q3 2025 Revenue in USD: $108,276.5 \div 7.1190 \approx US$15,209.5$ million2.
Q3 2025 Non-GAAP Diluted EPS per ADS in USD: $21.08 \div 4 \times 7.1190^{-1} \approx US$2.96$3.
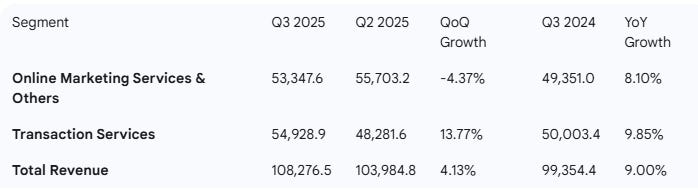
Segment Revenues (RMB in Millions)
Key Business Drivers and Performance Indicators
Slowing Revenue Growth: Total revenue growth was 9% YoY in Q3 2025, slightly better than 7% YoY in Q2 2025, but the Online Marketing Services segment saw a QoQ decline of -4.37%, suggesting pressure on the core advertising/take rate due to intensified competition and merchant support investments4.
Decelerating Operating Profit: GAAP Operating Profit grew by only 3.02% YoY in Q3 2025, significantly slower than the 17.40% YoY growth in Net Income, reflecting the continued impact of increased investments in the platform ecosystem and merchant support initiatives5.
R&D Investment Spikes: Research and Development expenses increased by 41% YoY in Q3 2025 to RMB4.3 billion, an all-time high, reflecting a focus on improving core technology capabilities and capturing opportunities in supply chain innovation and consumer experience6.
Merchant Support Programs: The RMB 100 billion support program and RMB 10 billion fee reduction initiative are major strategic initiatives continuing to be rolled out, which management expects to weigh on short-term profitability but drive long-term ecosystem health7.
Cash Flow Strength: Net cash generated from operating activities saw a substantial increase, rising to RMB45.7 billion in Q3 2025, up from RMB27.5 billion in Q3 20248.
Performance Summary
Overall, the company’s Q3 FY25 results missed consensus revenue expectations (-0.52%) but beat adjusted EPS expectations.
Revenue growth accelerated to 9.00% YoY (from 7.00% YoY in Q2), while Non-GAAP Diluted EPS per ADS growth also accelerated to 13.39% YoY. Revenue growth however in FY25 appears to be decelerating from prior high levels due to the impact of intensified competition and substantial investments in merchant support programs and the platform ecosystem, particularly impacting the Online Marketing Services revenue growth rate9.
2. Management Discussion & Analysis (MD&A) Comparison
Management Discussion (Current Quarter - Q3 2025)
Management’s discussion centered on the company’s 10th anniversary, re-emphasizing the core mission of “benefit all, people first, and more open”10. The key message is one of accepting slower growth and fluctuating profitability in exchange for a steadfast commitment to long-term value creation and social responsibility11. The discussion highlights the continuation and expansion of major initiatives like the RMB 100 billion support program, focusing on driving high-quality development, industrial upgrades, and support for SMEs and farmers12. A significant theme is the increasing complexity and uncertainty in the global business due to evolving regulatory, trade, and compliance standards, which is explicitly noted as a risk that is difficult to quantify and may impact financial performance13. Management explicitly warns that quarterly profitability will fluctuate, and linear projection is not appropriate for future performance14.
Management Discussion (Prior Quarter - Q2 2025)
The prior quarter’s discussion was primarily focused on addressing the direct negative impact of the RMB 100 billion support program and intensified competition on Q2 financial performance, noting that revenue growth further moderated and operating profit declined by 21% YoY15. Management framed this decline as a necessary consequence of prioritizing long-term value creation over short-term results and taking on “social responsibilities” to support the merchant ecosystem16. The discussion detailed specific, tangible examples of the support initiatives in action—such as RMB 10 billion fee reduction and logistics support—and their positive early effects in remote regions and industrial belts17. The outlook warned that profitability was likely to fluctuate in the coming quarters due to ramping up these investments18.
Semantic and Thematic Comparison
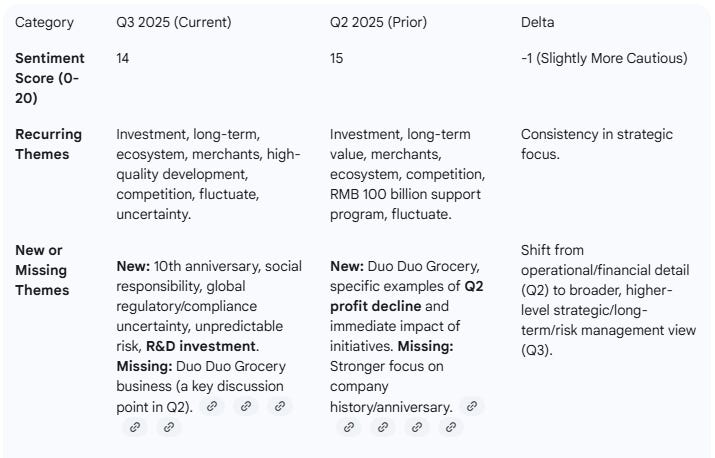
Tone Shifts
Compared to Q2, management’s tone in Q3 was more philosophical and strategic, rooted in the company’s 10th-anniversary context22. While Q2 was reactive, explaining the immediate financial pain (-21% operating profit YoY) of the investments 23, Q3 was preemptive, institutionalizing the volatility as a fundamental operating principle (”inherently unpredictable,” “linear projection might not be a good way”). The most significant shift is the new and heightened emphasis on the complex, uncertain global regulatory and geopolitical environment, explicitly citing it as a major risk factor impacting both short- and long-term financial performance. This signals a new, major challenge beyond domestic competition and ecosystem investment.
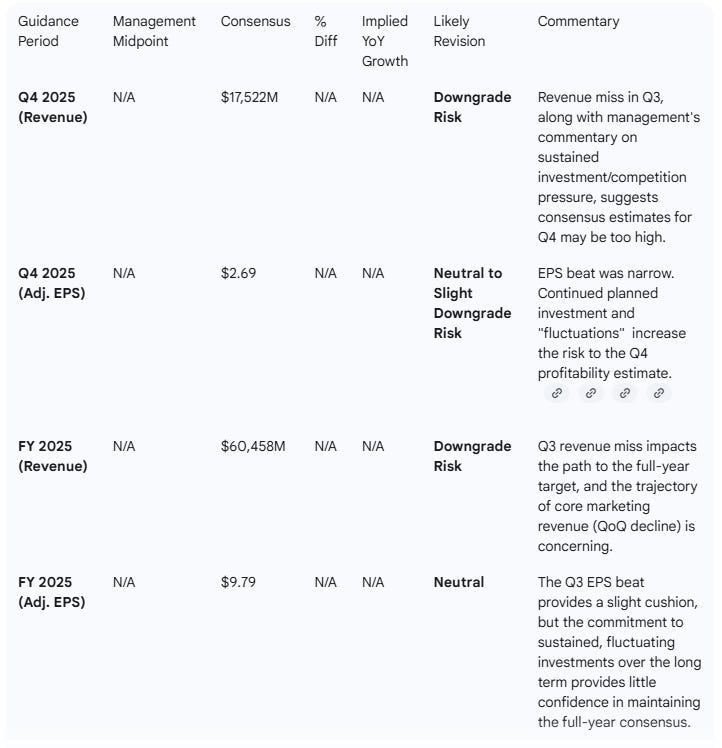
3. Guidance Evaluation and Consensus Implications
PDD Holdings did not provide quantitative financial guidance for Q4 2025 or the full fiscal year 2025 in the earnings materials. Management explicitly stated that Q3 profitability should not be seen as a reference, and fluctuations will continue, making linear projections inappropriate due to the increasing scale of long-term investments and external uncertainties.
Guidance Assessment
Since there is no explicit management guidance, the analysis focuses on the implied impact of the qualitative outlook on current consensus.
Metrics in USDm
Implied YoY Growth Calculation:
To meet the FY25 Revenue consensus of $60,458M (USDm), Q4 Revenue needs to be $60,458M - (Q1 + Q2 + Q3 FY25 Revenue).
Q1-Q3 FY25 Revenue (USD): $15,209.5M (Q3) + $14,515.7M (Q2) + Q1 $13,299m = $43,024M$.
Q4 25 Revenue needed: $60,458M - $43,024M = $17,434M.
Q4 24 Revenue was $15,261m
Implied Q4 YoY Growth for Revenue: 14%.
This implied Q4 revenue growth of 14% is significantly higher than the 9.0% achieved in Q3, making the consensus difficult to achieve given the headwinds and management commentary of not extrapolating current trajectory.
Assessment Summary: Analyst revisions are likely to be Downgrade-biased on revenue due to the Q3 miss and the qualitatively cautious outlook, which focuses on long-term strategy and short-term volatility rather than sales momentum. EPS may remain more resilient due to the Q3 beat, but the clear signal of sustained, large-scale investments means there is high risk to consensus.
4. What is Missing? 🛑
The Q3 report and transcript fell short of pre-earnings expectations in several key areas:
Quantitative Guidance: The most critical missing piece is the absence of quantitative guidance for Q4 2025 and FY2025, which is typical for high-growth stocks. Management’s repeated insistence on unpredictable financial fluctuation and the inappropriateness of linear projection can be interpreted by the market as a lack of visibility or confidence in short-term financial trajectory.
Deceleration of Core Revenue (Online Marketing Services): Market concern pre-earnings was centered on competitive take-rate pressure. The QoQ decline of -4.37% in the Online Marketing Services & Others segment, PDD’s core profitability driver, was a red flag. Management attributed this to investments/competition but provided little detail on how and when this trend would stabilize or reverse30.
Update on Global Business Financials: While management increased the emphasis on global regulatory risks and uncertainties, they did not provide a separate segment revenue breakdown or any quantitative metrics (e.g., number of markets, growth rates) for the global business, making it impossible to quantify the financial impact of the stated risks.
Duo Duo Grocery Strategy: In Q2, the Duo Duo Grocery business was a major discussion point, with management defending their continued investment after competitors exited. In Q3, this business was not mentioned in the prepared remarks or subsequent Q&A, leaving its strategic direction and financial burden unclear to the market.
5. Executive Summary Output
Stock: PDD Holdings ($PDD)
Quarter: Q3 FY25
Result: Miss consensus on Revenue (-0.52%) but Beat on Adjusted EPS (+1.83%).
Performance Summary
Revenue: RMB108.3bn, +9.0% YoY (Q2: +7.0% YoY).
Non-GAAP Operating Profit: RMB27.1bn, +1.2% YoY (Q2: -21% YoY).
Non-GAAP Diluted EPS per ADS: RMB21.08, +13.4% YoY (Q2: -4.5% QoQ).
Core Driver: Transaction Services Revenue accelerated to +13.8% QoQ, while the higher-margin Online Marketing Services Revenue declined by -4.4% QoQ, indicating significant pressure on the advertising take rate due to merchant support and competition.
Management Commentary
The tone was strategic and cautious, highlighted by the 10th-anniversary context of social responsibility and long-term value. The core theme is the commitment to sustained, fluctuating investment (RMB 100bn program) over short-term financial performance. The most notable shift was the explicit and repeated focus on heightened, unpredictable risks from the complex global regulatory environment (trade, tax, compliance). Management warned that linear projections are inappropriate.
Guidance Implications
No quantitative guidance was provided. The cautious qualitative outlook, coupled with the miss on revenue and decelerating core marketing revenue, implies high risk to Q4 and FY25 consensus revenue estimates, likely leading to revenue downgrades. EPS may be more stable due to the Q3 beat, but the sustained investment plan makes profitability highly volatile.
Conclusion
PDD’s Q3 report signals a pivot away from prioritizing top-line growth at all costs toward a strategy centered on long-term ecosystem entrenchment via significant, sustained investment and managing newly acknowledged global geopolitical and regulatory risk. The Q3 EPS beat provides little financial comfort, given the clear warning of future financial fluctuation and the decline in the core Online Marketing Services revenue. For investors, this report confirms PDD is trading growth for stability and the stock’s near-term performance will be governed by market acceptance of an investment-heavy, volatile profit outlook amidst rising global uncertainty.
7. Follow-ups
Do you want me to adjust any of the metrics in this AI generated output and have the report updated?
I can also provide, using the proprietary prompts from The INFERENTIAL INVESTOR:
Detailed earnings transcript analysis
A comprehensive Equity Research Report
Financial statement analysis with red flags and forensic checks
Segment Performance Breakdown — show revenue/EPS by business unit.
A comprehensive initiation report on the stock
Specialist industry analysis