

Palantir (PLTR) Q4 FY25 - Still accelerating with FY25 OpInc guidance 32% above consensus
Key Takeaways

The following report was generated with the Earnings Analysis Report prompt from the professional prompt library on The INFERENTIAL INVESTOR.
Subscribe to access these tools and stock research.
Important Disclaimer: The following stock discussion and analysis is subject to The Inferential Investor’s Disclaimer. It is indicative, designed to be educational and instructive on advanced techniques for AI in investment research and is not in any respect financial advice or an investment recommendation.
Authors note on valuation considerations for Palantir at the bottom…
Result Analysis: Palantir Technologies Inc. (PLTR)
Date: February 3, 2026
Report: Q4 FY2025 & Full Year 2025
Performance Highlights and Quantitative Comparison
Palantir delivered a robust beat across all key metrics in Q4 2025, driven by accelerating momentum in its U.S. Commercial business and sustained government demand. The company continues to demonstrate significant operating leverage, with the “Rule of 40” score reaching an exceptional 127%.
Financial Performance Table
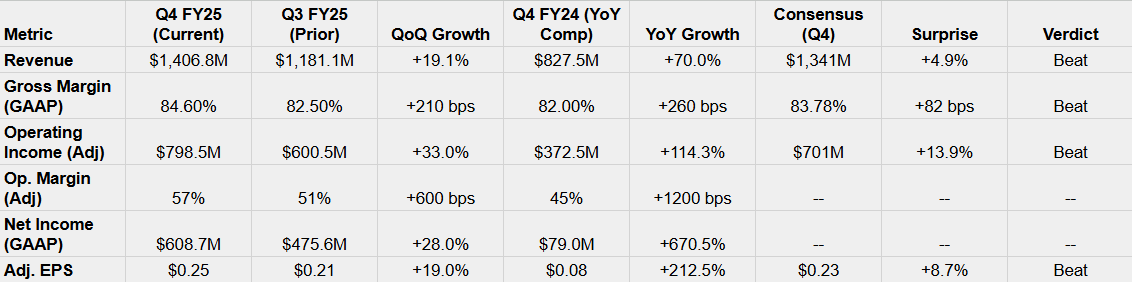
Note: Q4 FY24 Revenue and Net Income figures derived from Q4 FY25 comparative tables. Q3 FY25 figures sourced from Q3 Earnings Release.
Key Business Drivers
U.S. Commercial Acceleration: U.S. commercial revenue grew 137% YoY to $507 million, significantly outpacing the total revenue growth. This segment now accounts for 36% of total revenue, up from 26% a year ago.
AIP Momentum: The Artificial Intelligence Platform (AIP) is the primary engine for this growth. The “Bootcamp” sales strategy is converting pilots to contracts rapidly, evidenced by a 67% YoY increase in U.S. Commercial Total Contract Value (TCV).
Government Stability: U.S. Government revenue grew 66% YoY, showing re-accelerated demand for defense software amidst geopolitical instability.
Operational Leverage: Adjusted operating margin expanded to 57% (vs 45% YoY), demonstrating that revenue growth is significantly outpacing expense growth.
Performance Summary
Overall, Palantir’s Q4 results beat consensus expectations comfortably, with 70% revenue growth and 8.7% EPS outperformance.
Growth is accelerating meaningfully (up from 63% YoY in Q3 to 70% YoY in Q4), driven primarily by the viral adoption of AIP in the U.S. commercial sector and a resurgence in government spending.
Management Discussion & Analysis (MD&A) Comparison
Management Discussion (Current Quarter - Q4 FY25)
In Q4, CEO Alex Karp adopted a triumphant and highly confident tone, emphasizing Palantir’s unique position as an “n of 1” in the AI landscape. The narrative centered on the “undeniable” impact of AIP, with Karp noting that Palantir is “alone in choosing to exclusively focus on scaling the operational leverage made possible by... AI models”. The discussion highlighted the sheer scale of U.S. demand (”crushing consensus expectations”) and the structural shift in the business model toward mass-market AI adoption. The “Rule of 40” score of 127% was presented as a definitive validation of their efficiency and growth profile.
Management Discussion (Prior Quarter - Q3 FY25)
In Q3, the tone was also optimistic but focused heavily on the initial validation of the AIP strategy. Management highlighted the “transformational impact” of compounding AI leverage and the surge in U.S. growth. The narrative was about proving the “Bootcamp” model works and showcasing early scaling metrics. There was a strong focus on specific customer wins and the “changing nature” of the sales cycle, moving from pilot to production faster than before.
Semantic Comparison & Tone Shift
Sentiment Score:
Q4: 19/20 (Euphoric/Dominant)
Q3: 17/20 (Highly Confident)
Delta: +2.0
Recurring Themes: “AIP,” “U.S. Commercial,” “Rule of 40,” “Operational Leverage,” “Bootcamps.”
New/Shifted Themes:
Q3 Theme: Validating the AI strategy and sales cycle changes.
Q4 Theme: Dominance and “Commodity Cognition.” The language shifted from “proving” the model to asserting market supremacy (”n of 1,” “crushing expectations”).
Tone Shift: The tone shifted from validation to supremacy. In Q3, excitement came from the surge in growth numbers. In Q4, the excitement evolved into a conviction that Palantir has structurally separated itself from competitors.
Guidance Evaluation and Consensus Implications
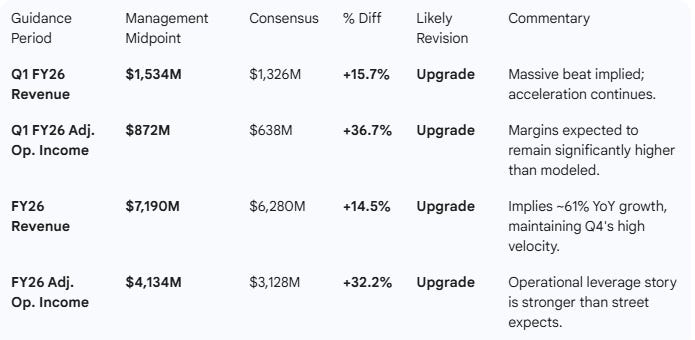
Management provided guidance for Q1 FY26 and Full Year FY26 that is significantly above current consensus estimates, signaling continued acceleration.
Guidance vs. Consensus Table
Consensus Implications
Direction: Strong Upgrades. The gap between management guidance and consensus is wide (>14% on revenue, >30% on profit).
Analyst Reaction: Analysts will likely scramble to raise FY26 numbers. The FY26 revenue guide of ~$7.2B implies a growth rate of ~61% YoY, which is consistent with the Q3->Q4 acceleration trend but far above the previous consensus of ~$6.3B. The profitability guide is particularly shocking, suggesting margins will sustain ~57% levels rather than compressing.
What is missing?
Net Revenue Retention (NRR) Granularity: While “Net Dollar Retention” was reported as 139%, a breakdown between Government and Commercial NRR would clarify if the government expansion is solely new contracts or expansion of existing ones.
AIP Specific Monetization Details: While AIP is the driver, specific breakout revenue for AIP-only contracts vs. legacy Foundry contracts remains bundled. Investors may look for more color on pricing power specific to AIP features.
International Commercial Weakness? The report heavily highlights U.S. Commercial (+137%). Global revenue grew 70%, implying international markets are growing slower than the U.S. More detail on Europe/Asia headwinds would be beneficial to assess global risks.
Stock-Based Compensation (SBC) Forecast: While GAAP net income is positive, SBC remains high ($196M in Q4). Explicit guidance on SBC trends for FY26 is not detailed in the outlook text.
Executive Summary
Stock: Palantir Technologies Inc. (PLTR)
Quarter: Q4 FY2025
Result: Significant Beat. Palantir crushed consensus on both top and bottom lines. Revenue of $1.41B (+70% YoY) beat the $1.34B target, and Adjusted EPS of $0.25 beat the $0.23 target.
Performance Summary:
Revenue: +19% QoQ and +70% YoY, demonstrating accelerating growth velocity compared to Q3 (+63% YoY).
U.S. Commercial: The star performer, growing 137% YoY driven by insatiable demand for AIP.
Profitability: Adjusted Operating Margin hit 57%, a massive expansion from 45% a year ago, showcasing potent operational leverage.
Management Commentary:
Management’s tone has shifted from “optimistic” to “dominant.” CEO Alex Karp described the company as an “n of 1,” separating itself from the broader software market. The narrative focus is entirely on scaling the “commodity cognition” of AI into operational advantages for U.S. enterprises and government.
Guidance Implications:
Guidance for FY26 is a “shock and awe” print. Revenue guidance of ~$7.19B is 14.5% above consensus, and operating income guidance is 32% above consensus. This ensures a wave of upward analyst revisions.
Conclusion & Authors Valuation thoughts:
Palantir has successfully transitioned from a niche government contractor to a dominant AI platform for U.S. enterprise. The acceleration in revenue growth combined with expanding margins is driving continued earnings surprise and proving the operational leverage of the business model. With Palantir’s valuation, a slowdown would have been likely greeted with selling as occurred with Microsoft. The acceleration and extent of the FY26 implied upgrades provides significant support to the share price with the likelihood that analyst target prices shift higher again.
Palantir already has a market capitalization of approximately $350-$380bn following the after market share price rebound, similar to Anthropic’s latest funding round. Investors will be assessing the extent of further upside on both absolute and relative approaches. Anthropic is an interesting comparison as it has similar FY25 revenues to Palantir and an enterprise and increasingly agentic business focus. However Anthropic is growing faster with a FY26 revenue projection of $18bn moving to a projected $55bn in FY27 and as much as $148bn in FY29. Palantir is likely to materially fall behind these revenue projections over that period (eg PLTR FY26 revenue projection of $7bn vs $18bn for Anthropic).
The earnings comparison between the two is the direct opposite with Palantir already achieving 57% operating margins and Anthropic loss making. Palantir’s asset light, software based business model (where clients incur the high data center related and inference costs themselves) is highly cash generative while Anthropic’s focus on the LLM “brains” which require significant costs related to model training and inference (compute, data center infrastructure) is capital and depreciation heavy and will have terminal margins lower than Palantir. The simple fact is that both businesses are complementary but valuation comparisons will be made. Palantir to date has really been the only large pure AI software play on the market with all other majors reliant on other legacy businesses and often that attracts a premium to the valaution. As the native AI foundational model companies come to market in 2026, this will force comparisons and a risk persists that it may shift money or generate a reassessment of valuation.
Palantir may again exceed its internal projections for FY26, however this is the year that it starts to lag Anthropic’s revenue growth which will focus investors on comparative valuations with Anthropic moving to a reported IPO this year with discovery likely on medium term operating earnings projections that will be compared naturally to Palantir.