

NVIDIA (NVDA) Q4 FY26 Earnings Analysis & Q1 Guidance Report: Upgrades to Q1 Revenues but EPS Confusion likely with SBC reclassified

The following report was generated with the Earnings Analysis Report workflow from the AI Assisted Equity Research Library on The INFERENTIAL INVESTOR. Subscribe to access these tools and feel free to share with colleagues.
Important Disclaimer: The following stock discussion and analysis is subject to The Inferential Investor’s Disclaimer. It is indicative, designed to be educational and instructive on advanced techniques for AI in investment research and is not in any respect financial advice or an investment recommendation.
NVIDIA CORPORATION
Q4 FISCAL YEAR 2026 EARNINGS ANALYSIS
Quarter Ended January 25, 2026
Report Date: February 26, 2026
1. Performance Highlights & Quantitative Comparison
1.1 Key Financial Metrics Summary
NVIDIA delivered record quarterly revenue of $68.1 billion in Q4 FY26, representing 20.0% sequential and 73.0% year-over-year growth. Results exceeded consensus expectations across all key financial metrics, with non-GAAP EPS of $1.62 beating the $1.54 consensus estimate by approximately 5.2%. The quarter demonstrated accelerating gross margin expansion, with non-GAAP gross margin of 75.2% exceeding both consensus and prior quarter levels as the Blackwell architecture continued to ramp with an improved cost structure.
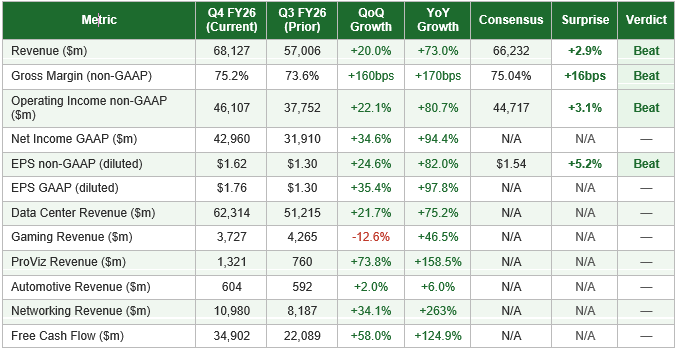
Note: Non-GAAP figures used for margin and EPS comparisons against consensus, consistent with street practice. FY26 full-year non-GAAP EPS of $4.77 versus consensus of $4.70 represents a 1.5% beat. Beginning Q1 FY27, NVIDIA will include stock-based compensation in non-GAAP measures, requiring consensus recalibration.
1.2 Segment Revenue Analysis
Data Center remained the dominant revenue driver, accounting for approximately 91.5% of total Q4 FY26 revenue at $62.3 billion. The segment grew 75% year-over-year and 22% sequentially, driven by the Blackwell architecture ramp across hyperscaler, sovereign, and enterprise customer categories. Notably, networking revenue surged 263% year-over-year and 34% sequentially to $10.98 billion, reflecting growing NVLink compute fabric adoption for GB200/GB300 systems — a positive signal for deepening infrastructure integration and platform stickiness.
Gaming revenue of $3.73 billion declined 12.6% sequentially as channel inventory normalised post-holiday season, though this remained up 46.5% year-over-year on strong Blackwell PC GPU demand. Management explicitly flagged supply constraints as a headwind for Gaming in Q1 FY27, representing a potential near-term revenue drag for this segment. Professional Visualization delivered exceptional growth of 159% year-over-year and 74% sequentially to $1.32 billion — a standout performer driven by Blackwell workstation and DGX Spark demand.
Automotive continued its gradual ramp at $604 million, up just 6% year-over-year, reflecting a significantly slower growth cadence relative to other segments. While Automotive grew 39% for the full fiscal year to a record $2.35 billion, quarterly momentum has moderated from prior periods.
1.3 Key Business Performance Drivers
• Blackwell Architecture Ramp: Blackwell Ultra is now the lead architecture across all customer categories, with sequential gross margin expansion validating improved cost structure and mix as the platform matures.
• Networking Inflection: NVLink networking revenue growth of 263% YoY represents a structural shift toward full-scale data centre deployments, with per-system networking content growing materially relative to prior GPU generations.
• Revenue Diversification: Data Center customer mix broadened, with hyperscalers at slightly over 50% of Data Center revenue — a decline in concentration from prior periods — while growth was led by non-hyperscaler customers, including sovereign AI and enterprise.
• China Revenue: H20 sales remained insignificant in Q4 FY26, and management has explicitly excluded any Data Center compute revenue from China in Q1 FY27 guidance. This represents a meaningful and permanent headwind given China historically contributed mid-to-high single digits of Data Center revenue.
• Operating Expense Growth Acceleration: Non-GAAP operating expenses grew 51% year-over-year and 21% sequentially in Q4, driven by engineering development materials, compute and infrastructure costs. This rate of increase warrants monitoring relative to revenue growth.
• Free Cash Flow: Q4 free cash flow of $34.9 billion represents the strongest quarterly FCF in company history, up 58% sequentially. Full-year FY26 FCF of $96.6 billion reflects exceptional cash generation capacity.
• Shareholder Returns Moderation: Q4 share repurchases of $3.8 billion were materially lower than Q3’s $12.5 billion, reflecting significant strategic investment activity including the $13 billion Groq transaction and $12.8 billion in non-marketable equity securities purchases.
Overall, NVIDIA’s Q4 FY26 results beat consensus expectations, with 73% revenue growth year-over-year and non-GAAP EPS growth of approximately 82% year-over-year. Growth appears to be sustaining at high rates with incremental acceleration potential as the Blackwell Ultra and Vera Rubin roadmap progressively address broader inference and agentic AI workloads.
2. Management Discussion & Analysis — Comparative Review
2.1 Management Discussion (Current Quarter — Q4 FY26)
CEO Jensen Huang’s commentary for Q4 FY26 centred on a declared inflection point in agentic AI adoption, describing Grace Blackwell with NVLink as the dominant inference platform and flagging Vera Rubin as its imminent successor delivering an order-of-magnitude further cost reduction. Management characterized enterprise adoption of AI agents as “skyrocketing” and described NVIDIA’s customers as racing to invest in AI compute factories. CFO Colette Kress noted that hyperscalers remained the largest single customer category at slightly above 50% of Data Center revenue, while growth was led by the diversified remainder of the customer base — including sovereigns, enterprises, and cloud-native AI companies. The CFO highlighted that inventory supply-related commitments had reached $95.2 billion, the largest such commitment on record, underscoring NVIDIA’s forward confidence in sustained demand. The explicit exclusion of China Data Center compute revenue from Q1 FY27 guidance was a notable and cautious disclosure.
2.2 Management Discussion (Prior Quarter — Q3 FY26)
CEO commentary in Q3 FY26 emphasised that “Blackwell sales are off the charts” and that cloud GPUs were sold out, declaring entry into a “virtuous cycle of AI.” Management framed demand in terms of broad ecosystem expansion — more foundation model makers, more AI startups, more industries, and more countries. The CFO noted Blackwell Ultra as the new leading architecture, with prior Blackwell seeing continued strong demand. The tone was notably supply-constrained and demand-inelastic — focused on accelerating delivery. The Q3 forward guidance for Q4 of $65.0 billion revenue represented approximately 1.9% below what was eventually delivered, indicating NVIDIA’s typical conservative guidance cadence. Inventory supply-related commitments stood at $50.3 billion versus the current quarter’s $95.2 billion, a near-doubling that signals a significant upward shift in management’s forward demand visibility.
2.3 Sentiment Analysis & Thematic Comparison
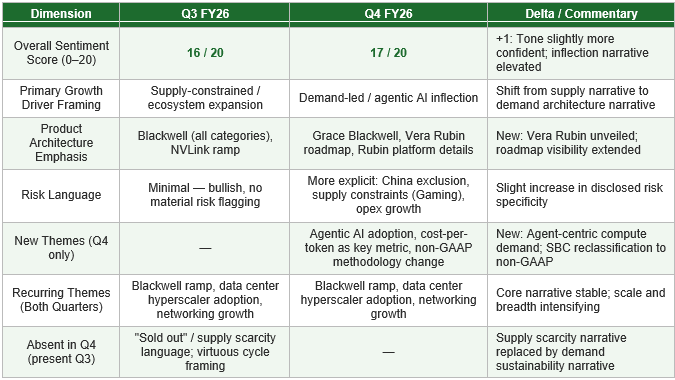
Compared to Q3 FY26, management’s tone in Q4 FY26 became marginally more measured on supply dynamics while escalating confidence in demand durability — shifting from a supply-constrained framing to an AI-infrastructure investment cycle narrative. The introduction of agentic AI as a primary demand catalyst represents a new thematic dimension not present in Q3. The explicit disclosure of zero China Data Center revenue assumptions in Q1 guidance, and supply headwinds flagged for Gaming, represent a modest but notable increase in risk transparency versus the near-universally bullish Q3 narrative.
3. Profitability, Cash Flow & Balance Sheet Analysis
3.1 Profitability Trends
Q4 FY26 non-GAAP gross margin of 75.2% marked a recovery and expansion to the highest level in recent quarters, up 160 basis points sequentially from Q3’s 73.6% and 170 basis points above the year-ago period’s 73.5%. This validates management’s prior guidance that margins would improve as Blackwell ramped with better mix and cost structure. The full fiscal year FY26 non-GAAP gross margin of 71.3%, however, remains materially below FY25’s 75.5%, reflecting the meaningful one-time H20 inventory charges ($4.5 billion in Q1 FY26) and transition costs associated with migrating from Hopper to Blackwell full-rack scale solutions. On a normalised basis, the Q4 exit rate suggests the business has returned to a structurally healthy margin profile.
Non-GAAP operating income of $46.1 billion in Q4 implies a non-GAAP operating margin of approximately 67.7%, up from 66.2% in Q3 FY26. The sequential expansion of approximately 150 basis points despite a 21% increase in non-GAAP operating expenses reflects the operating leverage inherent in NVIDIA’s business model at current revenue scale. GAAP net income of $42.96 billion was materially boosted by $5.49 billion in unrealised gains on non-marketable and publicly-held equity securities (including Intel common stock), resulting in GAAP EPS of $1.76 significantly above non-GAAP EPS of $1.62. Investors should note that this $5.49 billion OI&E gain is non-recurring in nature.
3.2 Cash Flow Trends
Operating cash flow reached $36.2 billion in Q4 FY26, a record quarterly figure up 118% year-over-year and 52% sequentially. For the full fiscal year, operating cash flow of $102.7 billion compares favourably against net income of $120.1 billion (cash conversion of approximately 85%), with the gap primarily reflecting large non-cash unrealised equity gains in GAAP net income. Free cash flow of $34.9 billion in Q4 represents a free cash flow margin of approximately 51.2%, reflecting the asset-light nature of NVIDIA’s design-led business model despite significant capex investment.
Full-year FY26 free cash flow of $96.6 billion represents a 59% year-over-year increase and underscores NVIDIA’s exceptional capital generation. Notably, capital expenditure of $6.0 billion for the full year remains modest relative to revenue scale, though it is increasing: Q4 capex of $1.28 billion was down sequentially but the multi-year cloud service agreement balance of $27.0 billion (up from $12.6 billion in Q3 FY26) suggests material off-balance sheet commitments to compute infrastructure are growing rapidly. This warrants monitoring as a potential future cash outflow.
3.3 Balance Sheet & Debt/Credit Analysis
Total assets reached $206.8 billion at January 25, 2026, up from $111.6 billion a year ago — an 85% increase driven primarily by earnings retention, non-marketable equity securities appreciation (now $22.25 billion), and higher working capital. Shareholders’ equity expanded to $157.3 billion from $79.3 billion, implying a debt-to-equity ratio of approximately 0.05x (on long-term debt of $7.47 billion), which is exceptionally conservative for a company of NVIDIA’s scale.
Total debt remains minimal at $8.47 billion (including $999 million short-term), unchanged year-over-year, while cash, cash equivalents and marketable securities stand at $62.6 billion. NVIDIA’s net cash position is therefore approximately $54 billion, providing substantial financial flexibility for strategic investment, M&A, and continued shareholder returns. The $13 billion Groq investment recorded in Q4 investing activities represents the most significant single strategic commitment, suggesting NVIDIA may be expanding its ecosystem investment strategy beyond its traditional GPU hardware/software scope.
Accounts receivable increased to $38.5 billion (DSO of 51 days, down from 53 days in Q3), and inventories rose to $21.4 billion. The sequential inventory build of $1.6 billion against total supply-related commitments of $95.2 billion (up from $50.3 billion in Q3) represents a material escalation in forward ordering — consistent with management confidence in sustained demand but also a potential inventory risk if demand decelerates unexpectedly.
The goodwill balance increased to $20.8 billion from $5.2 billion (Q4 FY25) and $6.3 billion (Q3 FY26), reflecting acquisition activity — a notable jump that may reflect the Groq transaction or other deals. The $3.3 billion intangible assets balance (up from $0.8 billion a year ago) similarly warrants monitoring for potential future impairment risk in the event of technology disruption.
4. Guidance Evaluation & Consensus Implications
4.1 Q1 FY27 Guidance vs. Consensus
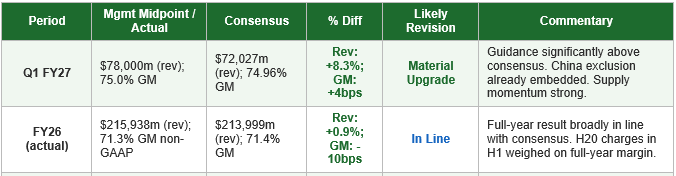
Management provided Q1 FY27 revenue guidance of $78.0 billion (±2%), representing a midpoint 8.3% above the $72.0 billion consensus estimate. This constitutes a material positive surprise relative to market expectations and represents the single most impactful element of the earnings release from a forward revision perspective. The non-GAAP gross margin guidance of 75.0% (inclusive of stock-based compensation now reclassified within non-GAAP measures) is essentially in line with the 74.96% consensus, with the methodology change limiting direct comparability.
It is essential to note that beginning Q1 FY27, NVIDIA will include stock-based compensation expense in its non-GAAP measures. This represents a definitional change of approximately $1.9 billion per quarter, which will mechanically reduce reported non-GAAP EPS relative to historical comparisons and current consensus models. Street estimates will require model updates to properly reflect this change when assessing forward earnings power on a comparable basis.
4.2 YoY Growth Implied by Guidance
The Q1 FY27 guidance midpoint of $78.0 billion implies approximately 76.1% year-over-year growth (Q1 FY26 revenue was ~$44.1 billion, i.e. FY26 total of $215.9 billion less the three quarters of Q2–Q4 FY26 totaling ~$171.9 billion). This would represent an acceleration relative to Q4 FY26’s 73% YoY and Q3 FY26’s 62% YoY growth, indicating revenue growth momentum is, at this guidance level, re-accelerating on a year-over-year basis.
4.3 Analyst Revision Assessment
The combination of a Q4 FY26 revenue beat of +2.9% and a Q1 FY27 guidance beat of +8.3% creates a strong foundation for consensus upgrades. We estimate the following revision dynamics:
• Near-Term (Q1 FY27): Consensus revenue estimates are likely to revise approximately 8-10% higher, with EPS estimates requiring careful adjustment for the non-GAAP SBC reclassification. Q1 FY27 non-GAAP EPS may modestly decline versus Q4 FY26 due to the SBC reclassification impact (~$1.9B / ~24.4B shares ≈ $0.08 headwind), before underlying earnings growth reasserts.
• Full Year FY27: Estimates are likely to revise 5-10% higher on a revenue basis, though FY27 EPS revision magnitude is less certain pending exact SBC treatment normalisaton across buy-side models. FY27 consensus of $7.86 non-GAAP EPS will likely need significant adjustment which will mechanically increase the forward P/E ratio at todays stock price.
• Margin Outlook: With Q4 non-GAAP gross margin at 75.2% and Q1 guidance at 75.0% (new methodology inclusive), the trajectory appears stable. Any margin upside from Vera Rubin platform mix or NVLink penetration could be an additional positive catalyst.
• China Risk: The explicit exclusion of China Data Center compute from guidance introduces a potential downside risk to estimates if market expectations had assumed some China contribution through alternative channels. This may be a modest negative revision catalyst for the most aggressive bull estimates.
5. Information Gaps & Emerging Risk Assessment
5.1 Information Gaps vs. Market Expectations
• Vera Rubin Timeline Precision: While the Rubin platform was unveiled with performance benchmarks (up to 10x reduction in inference token cost versus Blackwell), no concrete volume production or first-customer revenue timeline was provided. Market expectations ahead of the print had anticipated clarity on the Rubin deployment schedule — specifically whether hyperscalers would begin receiving systems in H1 or H2 FY27. This gap may sustain some uncertainty in modelling FY27 back-half revenue acceleration.
• China Strategy and H20 Successor: Management confirmed zero China Data Center compute revenue in Q1 FY27 guidance, but did not address whether a Hopper-equivalent China-compliant product for the next generation is under development or approved. Pre-earnings market concern about China revenue erosion was addressed directionally but not comprehensively, and the long-term China strategy remains opaque.
• Non-GAAP Methodology Change Impact on EPS Comparability: The reclassification of SBC to non-GAAP expenses beginning Q1 FY27 creates a significant comparable-period challenge. NVIDIA did not provide pro-forma restated historical non-GAAP EPS under the new methodology, making year-over-year EPS growth comparisons for Q1 FY27 and beyond difficult to assess without manual recalculation. This may create temporary confusion in published consensus comparisons.
• Groq Investment Rationale: The $13 billion investment in Groq (recorded as a separate line item in investing cash flows) was not explicitly elaborated upon in either the press release or CFO Commentary beyond a licensing agreement reference. Given its material size — equivalent to approximately 38% of Q4 FCF — the strategic rationale, expected return profile, and accounting treatment warrant additional disclosure.
• Gaming Supply Constraint Specificity: Management flagged supply constraints as a headwind to Gaming in Q1 FY27 and beyond, but did not quantify the expected revenue impact. Given Gaming contributed approximately 5.5% of Q4 FY26 revenue at $3.7 billion, analysts lacked sufficient data to refine near-term Gaming forecasts.
• Non-Hyperscaler Customer Detail: While Management disclosed hyperscalers represent slightly over 50% of Data Center revenue and that growth was led by other customers, no further breakdown of sovereign, enterprise, or cloud-native categories was provided. The market has increasingly focused on demand sustainability beyond hyperscaler capex cycles, making this a meaningful information gap.
5.2 Emerging Risks & Weak Signals
• Operating Expense Trajectory: Non-GAAP operating expenses grew 51% year-over-year in Q4 and 21% sequentially. Q1 FY27 non-GAAP opex guidance of $7.5 billion implies a further 47% year-over-year increase and 47% sequential increase from Q4. While revenues are growing faster, the absolute dollar increase in engineering and infrastructure costs represents a new cost base that may prove structurally elevated if revenue growth decelerates.
• Supply Commitment Concentration Risk: Total supply-related commitments of $95.2 billion — nearly doubling from Q3’s $50.3 billion in a single quarter — represent a significant forward commitment on management’s demand assumptions. Should AI infrastructure investment cycle moderate sooner than anticipated, inventory risk and potential impairments could emerge.
• Strategic Investment Portfolio Volatility: NVIDIA’s balance sheet now includes $22.25 billion in non-marketable equity securities (versus $3.39 billion a year ago), creating meaningful mark-to-market volatility risk that could significantly impact reported GAAP earnings in either direction. The $5.49 billion Q4 gain from these positions is not representative of recurring earnings power.
• Regulatory and Geopolitical Export Controls: The China exclusion from guidance acknowledges a structural demand restriction, but the risk of additional export control expansion — to other restricted geographies or next-generation architectures — remains a persistent and potentially escalating risk factor that could affect a wider portion of NVIDIA’s addressable market.
• Concentration in AI Capital Expenditure Cycle: NVIDIA’s extraordinary growth remains fundamentally dependent on sustained hyperscaler AI infrastructure investment. Any moderation in cloud provider capex commitments, driven by AI ROI challenges, broader economic deterioration, or technology substitution, could represent a rapid deceleration catalyst.
• Competitive Inflection — Custom Silicon: AMD, Intel, and increasingly hyperscaler custom silicon (Google TPUs, Amazon Trainium, Microsoft Maia) are developing competitive alternatives. While NVIDIA’s software ecosystem (CUDA) provides durable competitive advantage, the pace of custom silicon advancement across training and inference workloads could eventually constrain pricing power or market share, particularly at the inference layer where cost-per-token becomes the dominant purchasing criterion.
• Accounting Change — Non-GAAP SBC Reclassification: The inclusion of stock-based compensation in non-GAAP metrics beginning Q1 FY27 normalises NVIDIA’s reporting to a more conservative standard. The immediate EPS impact of approximately $0.08 per share per quarter may create an apparent EPS growth deceleration that is definitional rather than operational — but could nonetheless affect sentiment among investors who track headline non-GAAP EPS without adjustment.
6. Conclusion
NVIDIA’s Q4 FY26 earnings event delivered a strong beat-and-raise outcome that underscores the durability and expanding breadth of AI infrastructure investment: quarterly revenue of $68.1 billion (+73% YoY, +20% QoQ) exceeded consensus by approximately 2.9%, non-GAAP EPS of $1.62 beat by 5.2%, gross margins recovered to 75.2% validating the Blackwell cost structure normalisation thesis, and free cash flow reached a record $34.9 billion.
The Q1 FY27 revenue guidance of $78.0 billion — 8.3% above consensus — represents the most significant positive catalyst, reflecting accelerating demand from the agentic AI inflection, broad customer category diversification, and deepening NVLink networking infrastructure adoption (which surged 263% year-over-year).
Against this constructive backdrop, investors must weigh several emerging considerations: the complete exclusion of China Data Center compute from forward guidance introduces a structural headwind to addressable market; the near-doubling of supply-related commitments to $95.2 billion in a single quarter creates elevated inventory and demand-miss risk; the beginning of non-GAAP SBC reclassification will require model recalibration and may obscure apparent near-term EPS momentum; operating expenses are growing at a rate approaching 50% year-over-year which could compress margins should revenue growth decelerate; and the $22.25 billion strategic investment portfolio introduces material mark-to-market volatility into GAAP earnings.
The pace and breadth of Vera Rubin deployment, the evolution of non-hyperscaler enterprise AI adoption, and the trajectory of hyperscaler capital expenditure commitments through fiscal year 2027 are the most consequential variables for investors to monitor in the coming quarters.
─ END OF REPORT ─
This report was prepared using information contained in NVIDIA’s Q4 FY26 and Q3 FY26 press releases and CFO Commentaries. Consensus estimates as provided. This analysis does not constitute investment advice.