

Lemonade Inc. (LMND) Q4 FY25 Earnings Analysis Report: Fundamental Acceleration.
Beat across all metrics and guidance implies upgrades to Q1 FY26. Revenue acceleration and gross margin highlights.

The following report was generated with the Earnings Analysis Report workflow from the professional prompt library on The INFERENTIAL INVESTOR.
Subscribe to access these tools and stock research.
Important Disclaimer: The following stock discussion and analysis is subject to The Inferential Investor’s Disclaimer. It is indicative, designed to be educational and instructive on advanced techniques for AI in investment research and is not in any respect financial advice or an investment recommendation.
LMND Equity Research | Q4 FY2025 Earnings Analysis
Published: 20 February 2026
Analyst: Inferential Investor AI Research Engine | Source: LMND Q3 & Q4 FY25 Shareholder Letters
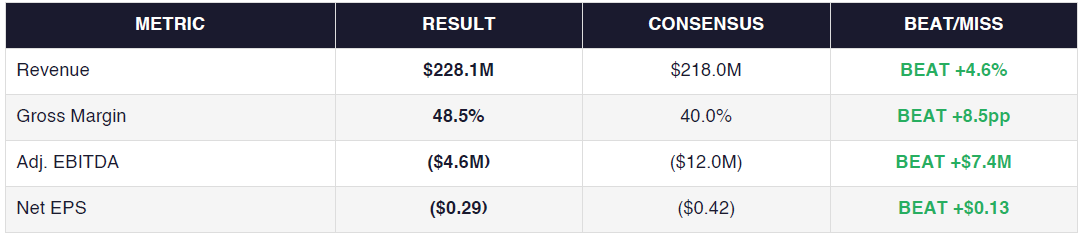
Overall Verdict: Lemonade’s Q4 FY25 results beat consensus expectations across all key metrics, with revenue +4.6% ahead, gross margin ~850bps above, and Adj. EBITDA dramatically better than consensus. Growth is clearly accelerating, driven by underwriting excellence, AI-led operating leverage, and compounding portfolio diversification.
PERFORMANCE HIGHLIGHTS & QUANTITATIVE COMPARISON
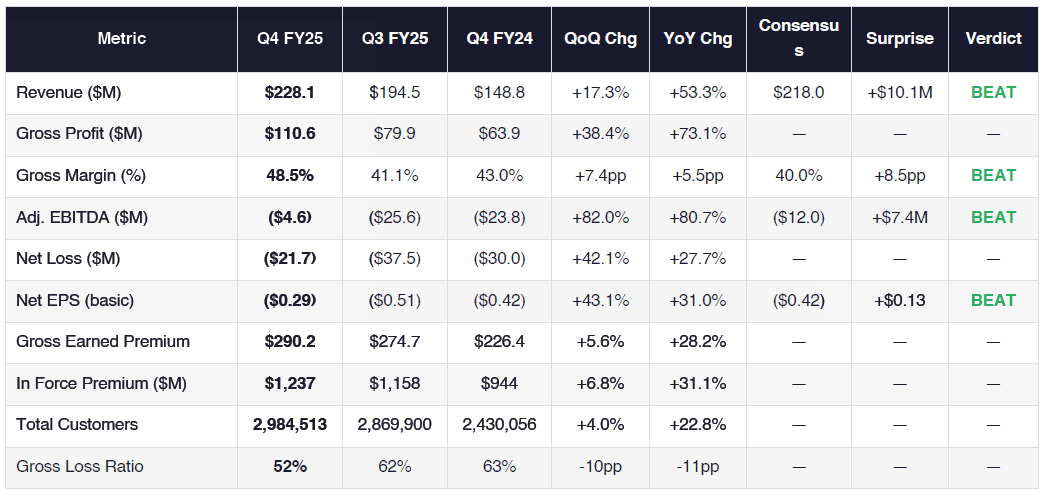
1.1 Key Metrics Comparison Table
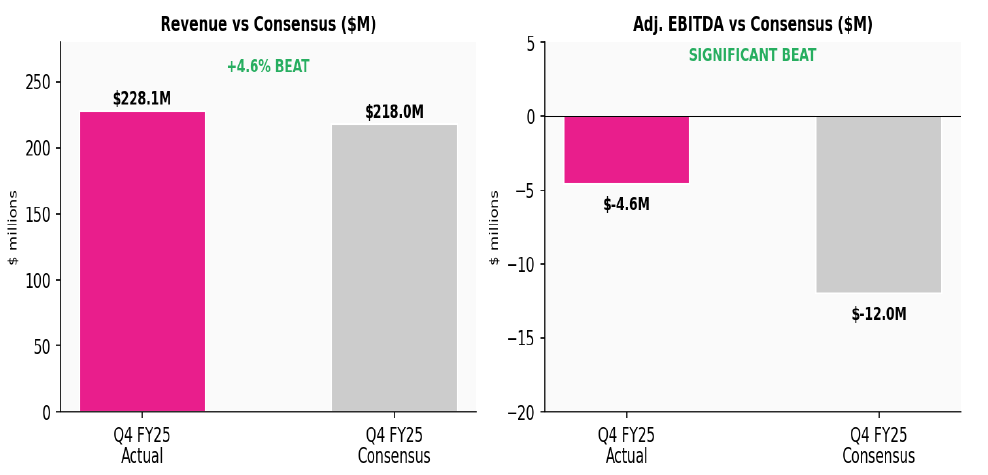
1.2 Revenue & EBITDA vs Consensus
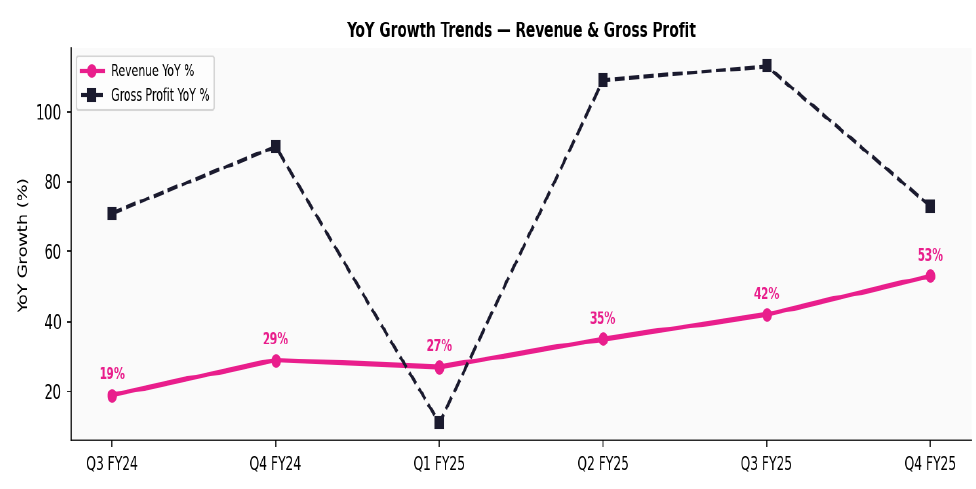
1.3 YoY Growth Trends
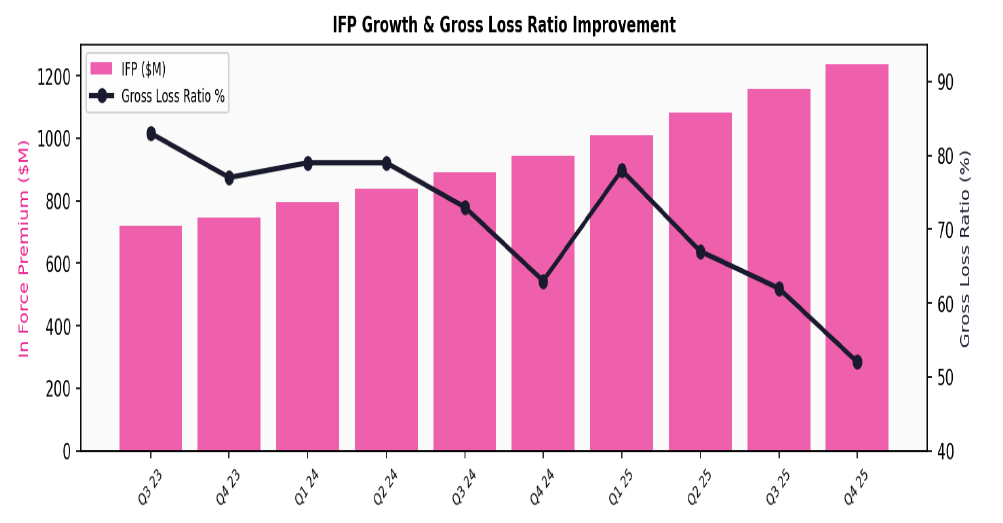
1.4 IFP Growth & Gross Loss Ratio Trajectory
1.5 Key Business Drivers
Revenue Acceleration (+53% YoY): Driven by GEP growth (+28%), reduced premium cession rate following the 2025 reinsurance renewal (materially increasing net earned premium), and growing ceding commission income. The structural shift in reinsurance structure meaningfully boosted revenue recognized.
Gross Margin Step-Change (48.5% vs 43% Q4’24): Gross loss ratio improved 11pp YoY to 52% — the best quarterly result in company history. Car’s gross loss ratio of 40% (Q4) benefited from year-end reserve movements (TTM: 70%). Attritional loss ratio improved 5pp YoY to 54%.
EBITDA Near Breakeven (-$4.6M): Revenue leverage drove substantial fixed-cost absorption. Adj. EBITDA improved $19.2M YoY despite growth spend increasing $17.4M YoY to $53.4M, demonstrating that gross profit growth is outpacing investment spend growth.
Ninth Consecutive Quarter of IFP Acceleration (31%): Pet (+55% sustained), Europe (+150%), and Car (53%) are the primary growth engines. Homeowners multi-peril IFP was essentially flat QoQ at $530M, reflecting selective underwriting.
AI-Driven Operating Leverage: Since Q3 2022, Lemonade added 1.2M customers while headcount declined 6%. Opex excluding growth spend grew from $87M to $101M while IFP grew from $609M to $1.24B — a 104% increase in scale with only 16% cost growth.
LAE Ratio at 6% (Q4’25): Loss Adjustment Expense ratio, now at 6%, is below the ~9% reported by incumbent carriers at far greater scale. Claims handling cost has been converted from variable to near-fixed, a structural advantage.
Performance Summary: Lemonade’s Q4 FY25 results beat consensus expectations across all measured metrics, with 53% revenue growth and a 27% improvement in net loss per share. Growth is accelerating, driven by structural underwriting improvement, AI-powered operating leverage, and a compounding flywheel across Pet, Europe, and Car.
MANAGEMENT DISCUSSION & ANALYSIS (MD&A) COMPARISON
2.1 Management Discussion — Current Quarter (Q4 FY25)
Management described Q4 2025 as Lemonade’s strongest quarter ever, characterized by three concurrent pillars: growth acceleration, underwriting excellence, and operating leverage. The opening shareholder letter framed the quarter as validation of a compounding business model in which faster growth expands the data advantage, which sharpens AI segmentation and pricing, which delivers stronger unit economics, which can be reinvested to drive further growth — a self-reinforcing flywheel. Revenue grew 53% and IFP extended its streak of accelerating growth to nine consecutive quarters. Management devoted considerable narrative space to the three product growth engines: Pet (mid-50s IFP growth, industry-leading $14 cost-per-claim), Europe (tenth consecutive quarter of triple-digit IFP growth, TTM loss ratio down 16pp to 74%), and Car (53% IFP growth, 60% conversion rate improvement, TTM loss ratio down 23pp). A notable new strategic theme was the announcement of autonomous pricing for Tesla Full Self Driving vehicles, signalling a long-term ambition to lead the transition to autonomy-aware insurance. Management also announced an Investor Day for November 2026.
2.2 Management Discussion — Prior Quarter (Q3 FY25)
In Q3 2025, management emphasized crossing the 30% IFP growth threshold ahead of schedule as a milestone reflecting eight consecutive quarters of accelerating growth. The letter’s central theme was the long-term operational transformation: IFP had grown 61% over two years while net loss as a percentage of GEP had improved from -36% to -14%. Management specifically highlighted AI-driven efficiency gains in claims handling, using the LAE ratio as a benchmark — Lemonade’s ratio of 7% was benchmarked against the ~9% reported by larger incumbents. Car insurance received dedicated coverage, with the gross loss ratio improving 16pp YoY to 76%, and management leaning into Car growth by expanding state coverage toward the top 10 US cities. The quarter’s tone was confident and data-driven, with management presenting a ‘path to profit that is plain to see’, though the language was slightly more cautious in nature than Q4’s declarative celebration.
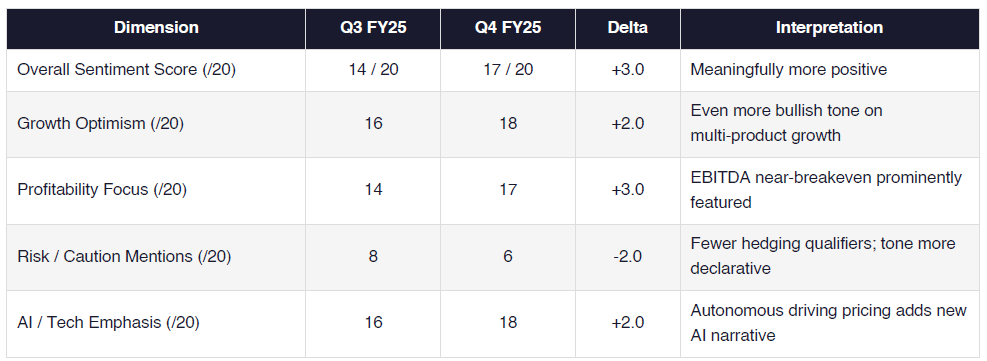
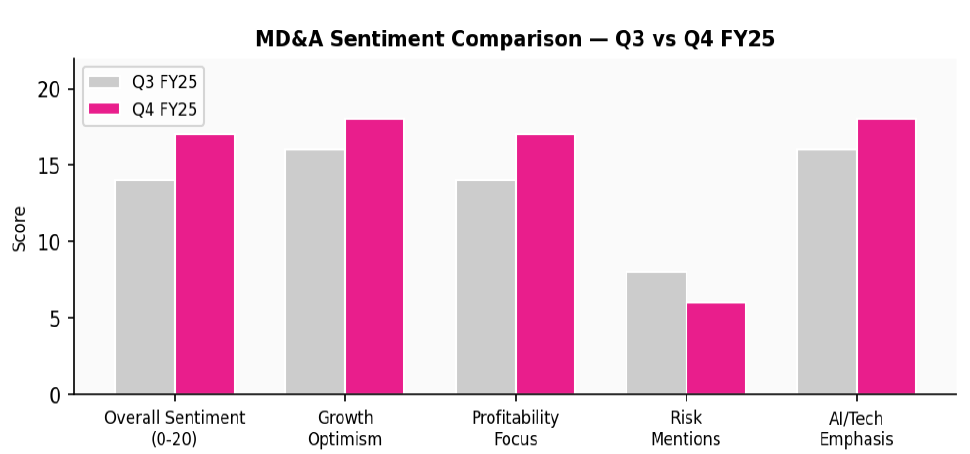
2.3 Semantic Comparison & Tone Analysis
2.4 Theme Shift Analysis
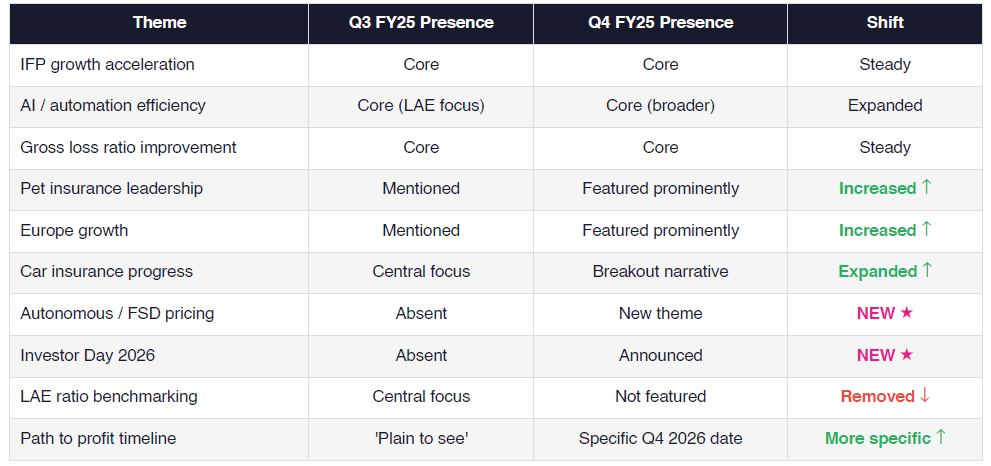
Compared to Q3, management’s tone in Q4 became meaningfully more celebratory and confident, with a decisive shift from milestone-setting (’crossing 30% growth ahead of schedule’) to achievement declaration (’strongest quarter ever’). The new autonomous pricing theme for Tesla FSD vehicles was a notable addition, signalling both product innovation and long-term strategic positioning. The removal of detailed LAE ratio benchmarking likely reflects that the efficiency story is now well-understood by the market, allowing management to redirect narrative real estate to future growth vectors.
GUIDANCE EVALUATION & CONSENSUS IMPLICATIONS
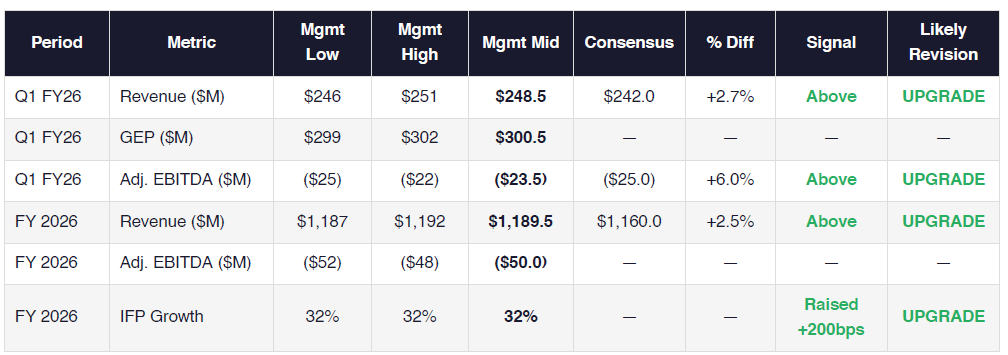
3.1 Management Guidance vs Consensus
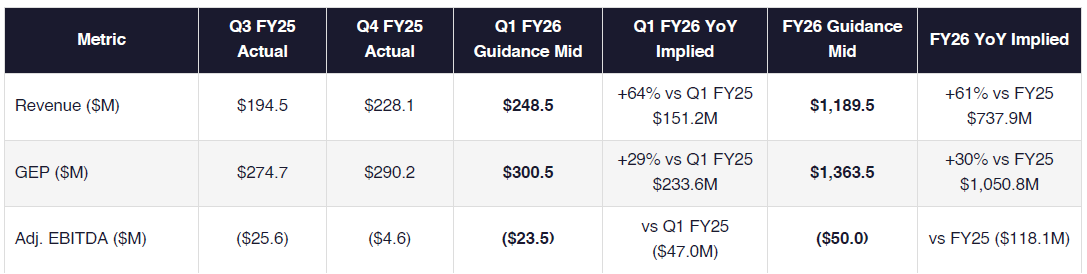
3.2 Implied YoY Growth from Guidance
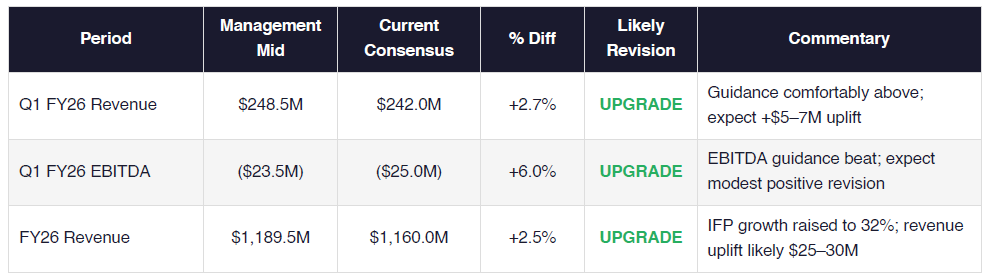
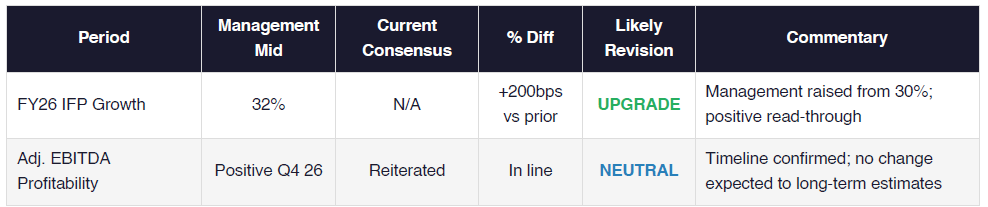
3.3 Analyst Revision Assessment
The Q1 FY26 revenue guidance midpoint of ~$248.5M sits 2.7% above the current consensus of $242M, implying analysts will need to upgrade Q1 estimates. The Q1 EBITDA guidance midpoint of ($23.5M) compares favorably to the ($25M) consensus, suggesting further EBITDA upgrades. For the full year FY26, the $1,189.5M revenue midpoint exceeds the $1,160M consensus by ~2.5%, while the IFP growth guidance of 32% — raised 200bps from prior comments — signals management confidence in sustained topline momentum. Given the scale of Q4’s outperformance (EBITDA beat of ~$7.4M, or ~62% of consensus loss), we expect the consensus upgrade cycle to be meaningful. Based on the trajectory, FY26 Adj. EBITDA consensus may move from around ($50M) toward ($45M)–($40M) as analysts incorporate both the Q4 beat and the raised guidance.
INFORMATION GAPS & MARKET EXPECTATIONS
• ADR (Annual Dollar Retention) Improvement: The market had been monitoring ADR carefully following its decline from 87% to 84% in early 2025. Q4 ADR of 85% (flat QoQ) is encouraging but management did not provide specific targets or a recovery timeline. Pre-earnings, investors expected greater colour on the path back to the 87%+ levels seen in 2024. This gap remains.
• Detailed Per-Segment Financials: While IFP by segment is disclosed, there is no per-segment revenue, gross profit, or loss ratio disclosure in GAAP terms. The market had been expecting greater segment-level granularity as Pet has become the largest line. The shareholder letter provides directional commentary but no auditable segment P&L.
• Car Insurance State Rollout Specifics: Management noted continued state expansion for Car but did not provide a specific timetable for remaining major states (e.g., New York, California) beyond Pennsylvania. Investors had expected more specific state launch commitments given the TAM expansion narrative.
• Reinsurance Structure Details for 2026: The 2025 reinsurance renewal was a key revenue driver in H2 FY25. There is no disclosure of the 2026 reinsurance terms or cession rate expectations, which matters significantly for revenue and margin modelling. This is a material information gap for analysts building FY26 models.
• Europe Profitability Timeline: Europe delivered 150% IFP growth with a TTM loss ratio of 74% — impressive progress — but management provided no specific timeline for when Europe will be Adj. EBITDA positive on a standalone basis. Pre-earnings, investors had expected more clarity on European unit economics.
• Tesla FSD Autonomous Pricing Scale: The autonomous pricing announcement for Tesla FSD (Supervised) was intriguing but no material financial metrics were disclosed — no policy count, premium impact, or expected contribution. The market will be uncertain how to model this initiative in the near term.
• Life Insurance Update: Lemonade Life has received minimal mention in recent letters. There is no update on policy volumes, loss ratios, or strategic priority for Life, which was originally positioned as a significant long-term product. Its absence from the narrative may signal a de-prioritization, but this has not been explicitly confirmed.