HOME DEPOT ($HD) 3Q 25 (YE Jan-26) Earnings Analysis Report
Soft at EPS with guidance downgrade. Distinctly more cautious management commentary.
The following report was generated with the Earnings Analysis Report prompt from the professional prompt library on The INFERENTIAL INVESTOR.
Subscribe to access these tools and stock research.
Executive Summary: Home Depot (HD) Q3 FY25 Analysis
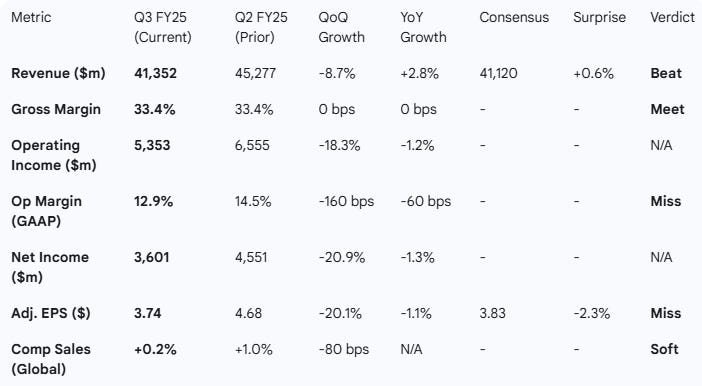
Consensus Comparison: Mixed. Home Depot beat revenue expectations (+0.6%) but missed on Adjusted EPS (-2.3%). The revenue beat was low-quality, driven entirely by the inorganic contribution from the recent GMS acquisition ($900m), without which revenue would have missed consensus.
Performance Trajectory: Decelerating. While headline sales grew +2.8% YoY, organic comparable sales were nearly flat (+0.2%), a significant slowdown from the +1.0% seen in Q2. Transaction volumes fell -1.6%, indicating that higher average tickets (inflation/mix) and acquisitions are masking underlying demand weakness.
Management Commentary: Distinctly more cautious. The optimistic tone from Q2 (”momentum,” “expectations met”) shifted to defensive language in Q3 (”missed expectations,” “consumer uncertainty,” “housing pressure”). Management cited a lack of hurricane/storm activity as a primary headwind, a sharp pivot from the weather recovery narrative in July.
Guidance Implications: Negative. FY25 guidance was cut. Adjusted EPS is now expected to decline ~5% (vs. prior guide of -2%), and comparable sales are expected to be “slightly positive” (vs. prior ~1%). This implies significant downward revisions for current consensus estimates.
Conclusion: The stock faces near-term pressure as the “higher-for-longer” interest rate environment continues to freeze housing turnover, a critical driver for HD’s large-ticket remodels. While the GMS and SRS acquisitions provide long-term structural advantages in the Pro market, they are currently dilutive to margins. Investors should expect downward earnings revisions for the remainder of FY25 and potentially FY26.
1. Performance Highlights and Quantitative Comparison
Home Depot delivered a mixed quarter where inorganic growth from acquisitions (SRS and the newly closed GMS) offset organic softness.
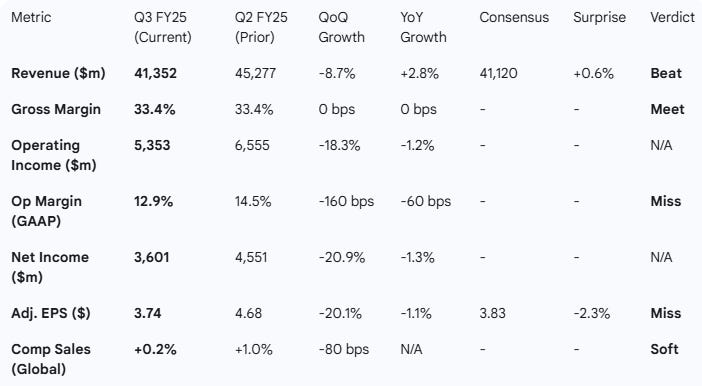
Performance Summary Table
Key Business Drivers:
Acquisition Impact: The GMS acquisition contributed ~$900m in sales (approx. 8 weeks of contribution). Without this, revenue would have been ~$40.45bn, missing the $41.12bn consensus.
Weather Headwinds: Management explicitly cited “lack of storms” in Q3 compared to historical norms as a drag on categories like roofing and emergency supplies.
Consumer Retrenchment: “Consumer uncertainty” and “continued pressure in housing” were cited as disproportionate headwinds.
Transaction Volume: Comparable transactions declined -1.6%, worsening from the -0.4% decline in Q2.
2. Management Discussion & Analysis (MD&A) Comparison
Management Discussion (Current Quarter - Q3):
Management struck a defensive tone, admitting results “missed our expectations” primarily due to unfavorable weather (lack of storms) and broader macroeconomic pressure. CEO Ted Decker highlighted that the expected demand increase in Q3 “did not materialize”. The narrative focused heavily on “controlling what we can control” and integrating the new GMS acquisition, with less emphasis on immediate organic growth opportunities.
Management Discussion (Prior Quarter - Q2):
In Q2, the tone was resilient and cautiously optimistic. Management stated results were “in line with our expectations” and cited “momentum” beginning in the back half of the prior year continuing. There was a strong focus on “growing market share” and the success of the Spring selling season, with weather mentioned as a recovering factor rather than a headwind.
Sentiment & Tone Analysis:
Sentiment Score:
Q2: 14/20 (Resilient/Constructive)
Q3: 9/20 (Cautious/Defensive)
Delta: -5 points.
Tone Shift: The confidence observed in Q2 (”executing at a high level,” “momentum”) has been replaced by caution (”uncertainty,” “pressure,” “did not materialize”).
Thematic Shifts:
New: “Lack of storms” appears multiple times as a specific excuse for the miss. “GMS” is a new dominant theme regarding integration.
Missing: The Q2 emphasis on “smaller projects” resilience faded, replaced by commentary on deferred large projects.
3. Guidance Evaluation and Consensus Implications
Management lowered full-year guidance, signaling that the hopes for a second-half recovery have been abandoned.
FY2025 Guidance vs. Consensus
*Calculated: FY24 Base $15.24 x (1 - 0.05) = $14.48.
**Calculated: FY24 Base $15.24 x (1 - 0.02) = $14.94.
Guidance Analysis:
Revenue: The “raise” in total sales growth (to 3.0% from 2.8%) is optically positive but fundamentally negative; it is driven entirely by the inorganic addition of GMS ($2.0bn contribution). Organic comps were cut from ~1.0% to “slightly positive.”
Earni
ngs: The EPS guidance cut is severe. Moving from a -2% decline to a -5% decline implies the Q4 exit rate will be weaker than previously modeled.
Consensus Impact: With an implied FY25 EPS of ~$14.48 versus the street’s $15.00, analysts will likely downgrade FY25 and FY26 estimates by 3-5% immediately.
4. What is Missing?
2026 Outlook Specifics: Management deferred detailed commentary on 2026/Fiscal 26 to their upcoming investor conference on December 9. Investors looking for a clear view on the “bottom” of the cycle were left waiting.
Tariff Impact Quantification: While tariffs were mentioned in Q&A as a potential factor, there was no specific quantification of the financial impact of potential new trade policies, despite “tariffs” being listed in the risk factors.
Election Impact: There was no direct discussion of how the recent election results might alter consumer sentiment or housing policy, other than vague references to “uncertainty.”
5. Key Stats
EPS vs Consensus:
Q3 Consensus $3.83 vs Actual $3.74 (Red bar, Miss).
YoY Revenue Growth Trend:
Q1 (Flat) -> Q2 (+4.9%) -> Q3 (+2.8%). Shows volatility driven by M&A vs Organic fade.


