

The Business "Moat" Cheat Code: How to Use AI and Hamilton Helmer’s 7 Powers Framework to Pick Durable Winners
Including 1 of 2 mega-prompt variants to run this analysis!

This could be the most important article you read for your portfolio going into 2026…
By The Inferential Investor. Access to this article is subject to our disclaimer.
In the world of investing how do you discern a temporary trend that reverses on you quickly, from a durable competitive advantage. Every bull market produces companies that skyrocket on hype, only to crash when competition or the cycle inevitably erodes their margins. The difference between a “trade” and a “compounder” lies in one very important but also difficult to measure concept: the economic moat.
While Warren Buffett popularized the term “moat,” strategy consultant Hamilton Helmer codified the physics of it in his seminal work, 7 Powers. Unfortunately, the term has also become the “marketing call” of the “buy my stocks” blogger. Its thrown about so loosely on Substack that you’d think every stock being pushed, has it. Unfortunately few really do - so how can you measure it and test the stock calls? This article gives you the tools and makes it simple.
The 7 Powers framework has real investment credibility - it has become the lingua franca of Silicon Valley venture capitalists and top-tier hedge funds alike. It is valuable because it moves beyond vague SWOT or Porter’s 5 Forces analyses to rigorously define the seven specific structural advantages that allow a business to generate persistent differential returns.
For the modern investor, mastering the 7 Powers can be the difference between chasing your tail and identifying the next Google, Microsoft , Palantir or NVIDIA. Lets break it down and show you how AI solves this problem for you (with a mega prompt included at the end).
Help us get this message around by sharing this article, liking and subscribing if you haven’t already. We have many more helpful techniques like this in the works that will help you get stronger investment insights, faster.
Why AI is the Ultimate Strategy Consultant
Historically, assessing a business against the 7 Powers required weeks of deep research. You had to dissect 10-Ks, interview experts, and understand industry history to determine if a company truly possessed “Process Power” or if it was just lucky.
This is where Large Language Models (AI) have changed the game. AI models are uniquely suited for strategic framework analysis for three reasons:
Pattern Recognition at Scale: AI has “read” the strategic history of thousands of companies. It can instantly recognize if a company’s strategy resembles Netflix in 2011 (Counter-Positioning) or IBM in 1990 (Switching Costs), drawing parallels a human might miss.
Removing Confirmation Bias: Investors often fall in love with a stock and invent a moat where none exists (any reader of stock blogs will recognize that). An AI, prompted correctly, acts as a dispassionate devil’s advocate, scoring a business objectively against strict criteria. You can even test your favorite substack’s stock calls against this framework.
Synthesis of Qualitative Data: Unlike a spreadsheet that only sees numbers, the 7 Powers framework is qualitative. AI excels at synthesizing “soft” data such as brand sentiment, workflow embeddedness, and organizational complexity, into a coherent thesis.
By pairing Helmer’s rigorous framework with AI’s processing power, both individual and professional investors alike can now perform strategy audits that rival management consulting firms.
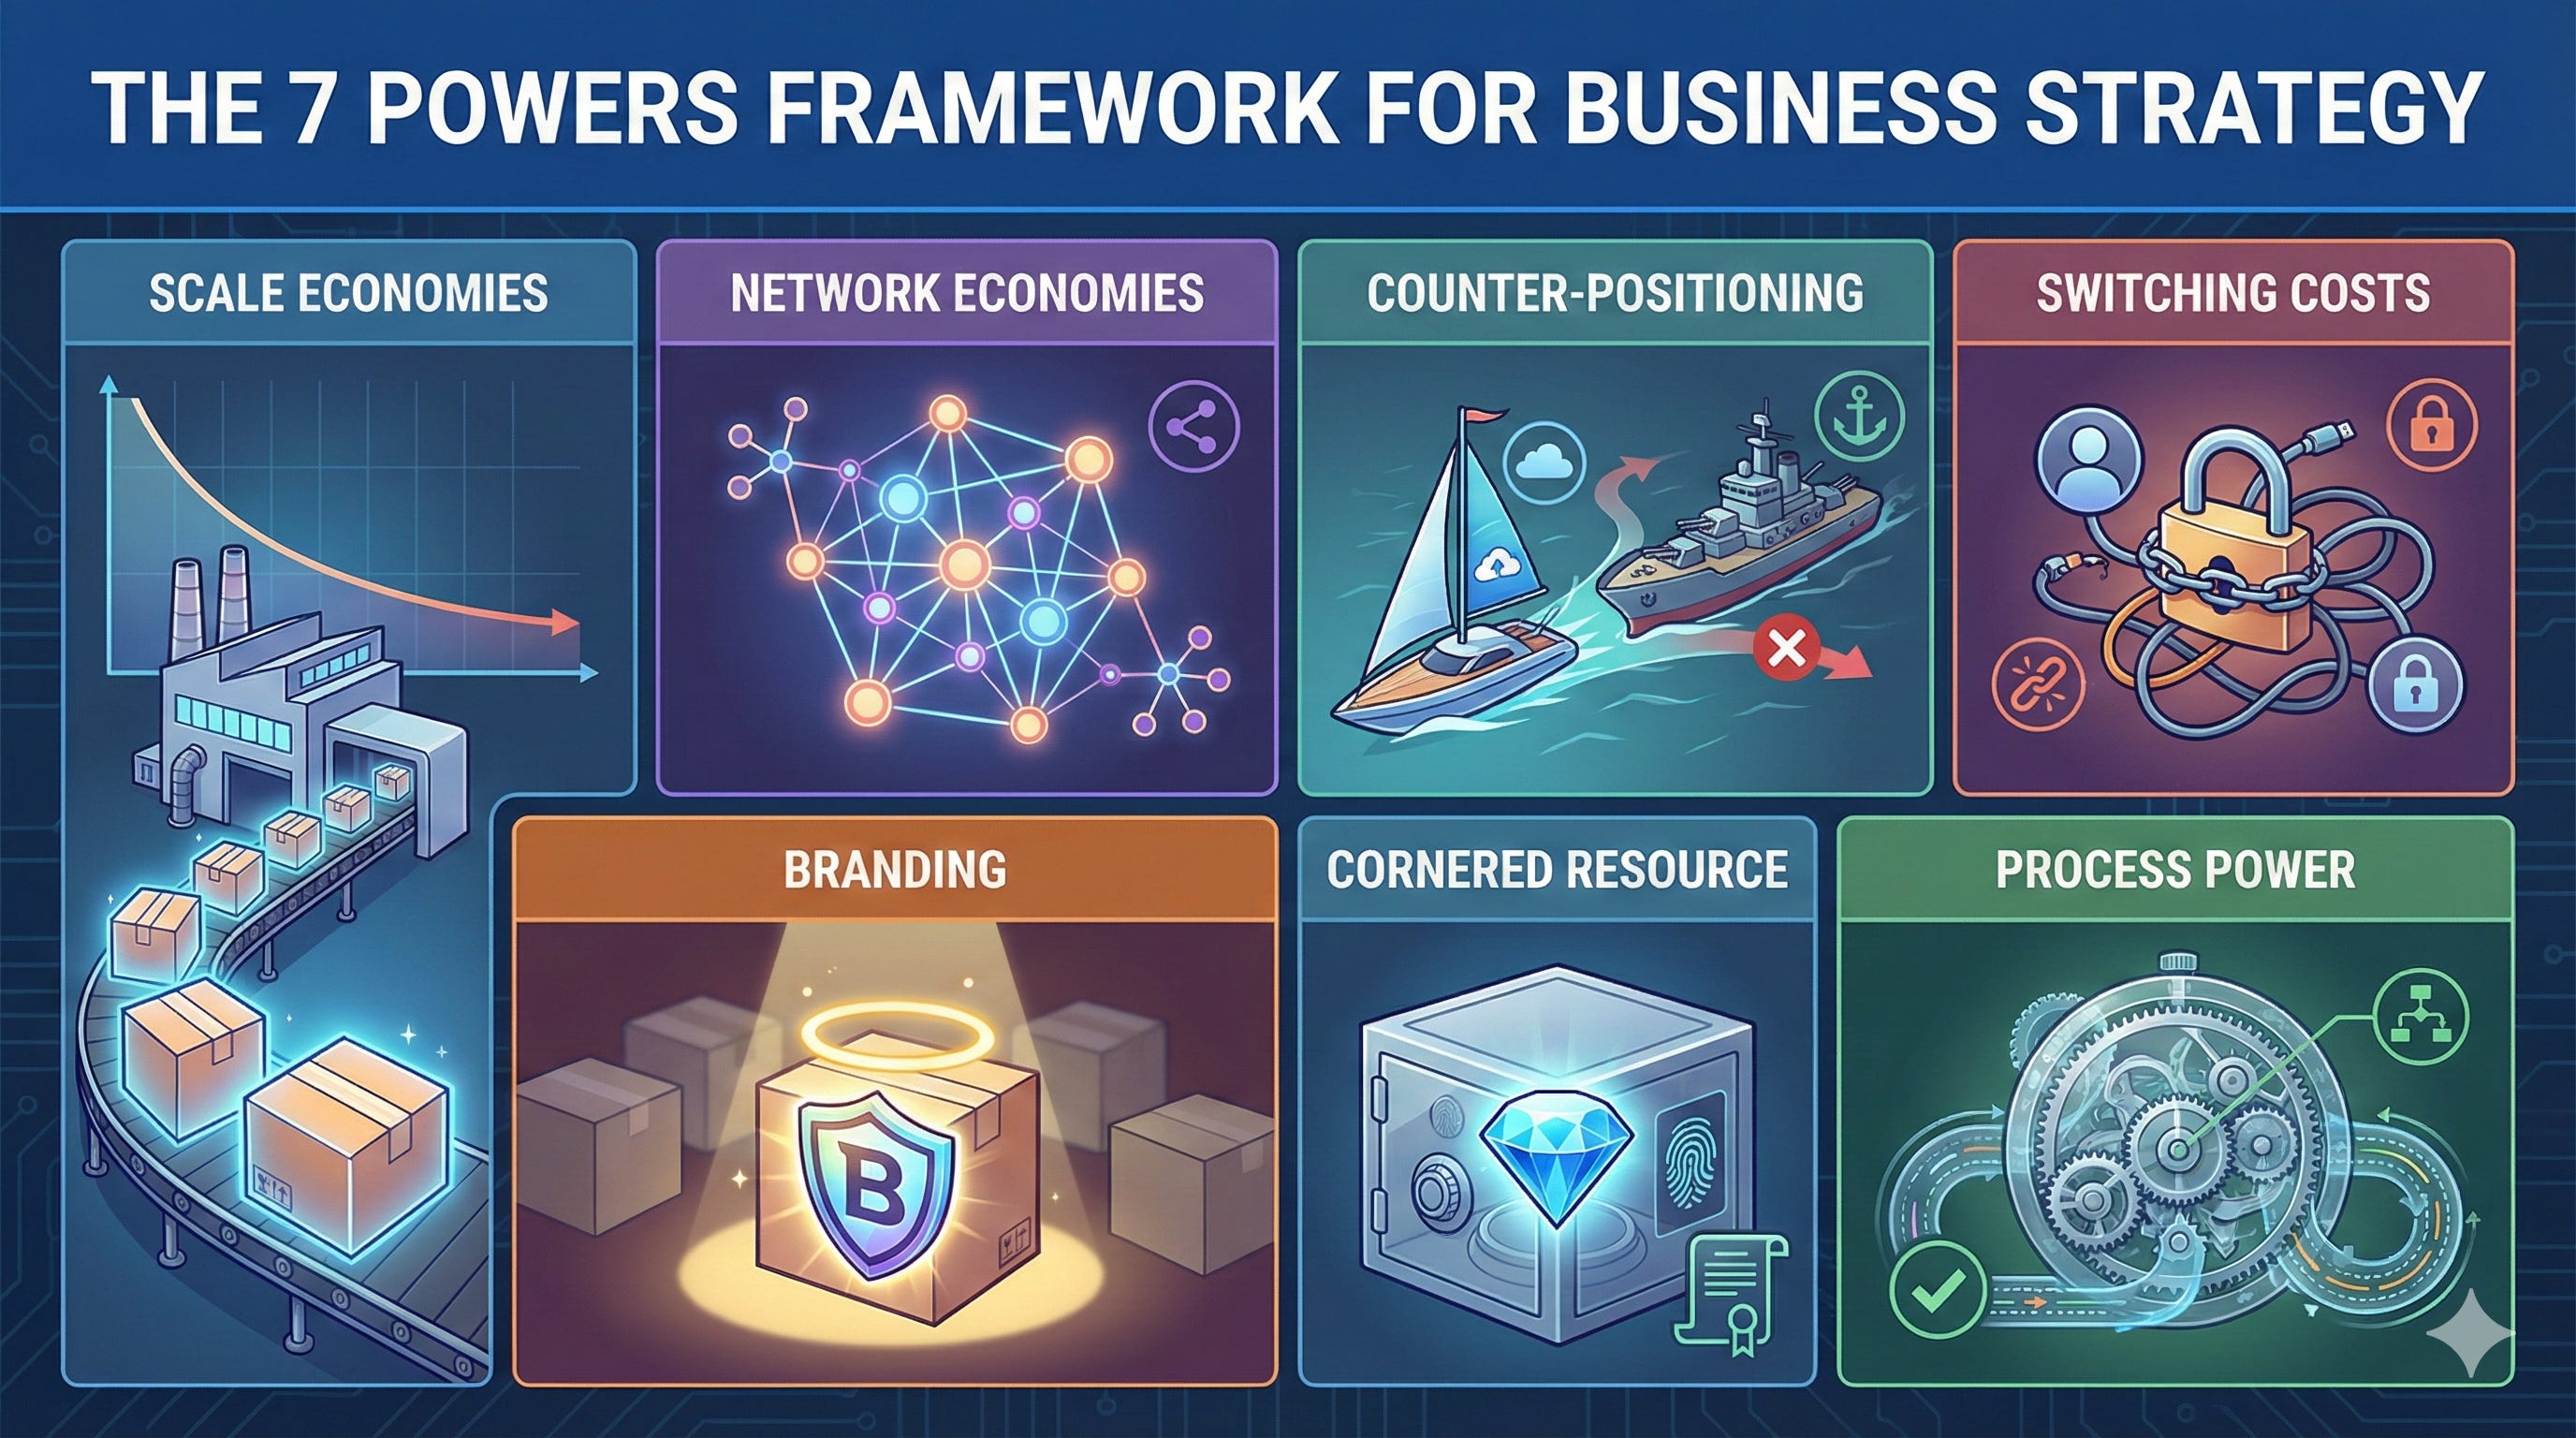
The 7 Powers: The DNA of Dominance
To use the framework effectively, you must first understand the specific attributes of each power. A company does not need all seven; often, a single dominant power (like Network Economies) is enough to build a multi-billion-dollar or even trillion dollar enterprise.
1. Scale Economies
The Definition: The quality where unit costs decline as production volume increases.
Why It Matters: If your fixed costs are high (e.g., building a factory or developing software), distributing those costs across a massive customer base allows you to price your product lower than any competitor while still maintaining higher margins.
How to Examine: Look for declining COGS or Operating Expenses as a percentage of revenue over time.
Examples:
Netflix: Because Netflix spreads its $17 billion content budget across 260 million subscribers, its “cost per subscriber” for a hit show is a fraction of what a smaller rival like Paramount+ pays.
Costco: Their massive purchasing volume allows them to demand lower prices from suppliers, which they pass on to customers, creating a loop that drives more volume—a classic scale flywheel.
2. Network Economies
The Definition: The value of a service increases for existing users as new users join.
Why It Matters: This is the Holy Grail of tech investing. It creates a “winner-take-all” dynamic where the leader becomes mathematically impossible to catch.
How to Examine: Ask, “Does my experience get better if my friend joins?”
Examples:
LinkedIn: A professional network with 1 million users is useless. One with 1 billion users is essential. No competitor can replicate this because the users are the product.
Visa/Mastercard: A classic two-sided network. Merchants accept Visa because everyone has a card; people carry the card because every merchant accepts it.
3. Counter-Positioning
The Definition: A new business model that incumbents cannot copy without damaging their existing business.
Why It Matters: It explains how startups kill giants. The incumbent sees the threat but is paralyzed because responding would cannibalize their cash cow.
How to Examine: Look for an incumbent who despite being the leader, has higher costs to serve than the challenger (eg newspapers vs online advertising businesses in the early 2000’s).
Examples:
Vanguard: They introduced low-cost index funds. Fidelity and others couldn’t copy them initially because doing so would slash the lucrative fees they earned from active management.
Salesforce: They launched “Software as a Service” (cloud). Giants like Siebel and Oracle couldn’t pivot quickly because their stock prices depended on massive upfront license fees.
4. Switching Costs
The Definition: The value loss or pain expected by a customer if they were to switch to a competitor.
Why It Matters: It gives a company pricing power. If leaving you is a nightmare, you can raise prices 5-10% a year without losing customers.
How to Examine: Look for high Net Revenue Retention (NRR) and products deeply integrated into daily workflows.
Examples:
Oracle/SAP: Once an Enterprise Resource Planning (ERP) system is installed, ripping it out is a multi-year, multi-million dollar surgery that could bankrupt a company. Customers stay for decades.
Intuitive Surgical (Da Vinci Robots): Surgeons train for thousands of hours on this specific robotic interface. Switching to a competitor requires relearning surgery—a cost no doctor wants to pay.
5. Branding
The Definition: The durable attribution of higher value to an objectively identical offering.
Why It Matters: It allows for irrational margins. It detaches price from cost.
How to Examine: Ask, “Would I pay a 30% premium for this product if it didn’t have the logo?”
Examples:
Tiffany & Co.: A diamond in a blue box sells for significantly more than the exact same diamond in a generic box. The “power” is the trust and signal of the blue box.
Ferrari: They artificially limit supply to maintain exclusivity. The brand is so powerful that customers wait years to pay hundreds of thousands of dollars for a car that is technically not “better” for commuting than a Toyota.
6. Cornered Resource
The Definition: Preferential access to a coveted asset that can independently enhance value.
Why It Matters: It is a legal or physical barrier to entry. No amount of money can replicate the resource.
How to Examine: Look for patents, regulatory licenses, or unique talent pools.
Examples:
ASML: They are the only company in the world that can make Extreme Ultraviolet (EUV) lithography machines. They have “cornered” the physics required to make advanced chips.
Pixar (Early Years): Helmer argues Pixar had a “brain trust” of creative talent (Lasseter, Catmull, Jobs) that acted as a cornered resource, producing hit after hit in a way no other studio could replicate.
7. Process Power
The Definition: Embedded company organization and activity sets which enable lower costs and/or superior product.
Why It Matters: It is the rarest power. It is not a “secret sauce” (recipe that can be replicated) but a “multi-faceted way of operating”. Competitors can see what you do but cannot replicate how you do it.
How to Examine: Look for companies with a long history of operational excellence that survives CEO changes.
Examples:
Toyota: The “Toyota Production System” (Kaizen) has been studied for 50 years. GM and Ford tried to copy it but failed for decades because the power was cultural, not just mechanical.
Inditex (Zara): Their ability to go from design to shelf in 3 weeks (fast fashion) requires a logistical complexity that H&M and Gap struggle to match efficiently.
How to Objectively Analyze the 7 Powers with The Inferential Investor tools
Understanding the framework and theory is step one. Step two is practical application. To assist in this, I have developed two specific AI prompt structures, ”The 7 Powers Assessment Tools”, that are located in the prompt library and use AI’s full capability suite to automate this rigorous analysis. If you care to follow the links, you will find under “Sample Report” on the specific prompt page, a fascinating head to head comparison of Google vs Microsoft with a very interesting conclusion! (BONUS!)
Variant 1: The “Deep Dive” (Single Company)
This prompt is designed for the “discovery” phase of research. You use this when you are considering buying a stock and need to know if the business is durable.
How it works: It forces the AI to act as a skeptical consultant. It goes through each of the 7 Powers one by one, demanding evidence and assigning a score (0-10).
The “Moat Score”: The prompt generates a total score out of 70.
< 15: Likely a commodity trap. This business would be weak on many fronts.
26-40: The “Investable Zone.” A strong, defensible business.
> 40: A legendary monopoly.
Why use it: It prevents “thesis creep.” If you think a company has a moat, but the AI scores it a “4” on Switching Costs and “2” on Branding, you might be looking at a fad, not a franchise.
Variant 2: The “Head-to-Head” (Comparative)
This prompt is for the “selection” phase and will become one of your most useful stock selection tools as it has for me. You have narrowed your choice down to two competitors—e.g., CrowdStrike vs. Palo Alto Networks or Uber vs. DoorDash—and need to know which one wins the war.
How it works: It creates a gladiator-style battle. It compares the two companies on each power to not only compare them, but also identify the “Kingmaker” attribute in that industry.
The Nuance: Often, two companies look similar financially, but one has a structural advantage. For example, in a comparison of Uber vs. Lyft, the “Scale Economies” power might be the tiebreaker. Uber’s global scale allows it to amortize R&D across more rides, giving it a permanent cost advantage over the domestic-only Lyft.
Why use it: Valuation often distracts investors. This prompt ignores stock price and focuses entirely on business quality, helping you identify which company will likely be the “largest man standing.”
Conclusion: The Mosaic of Business Quality
The 7 Powers framework is not a crystal ball, but it is a fairly useful compass. In a market dominated by noise, short-term earnings beats, and macroeconomic guessing games, Helmer’s framework brings you back to the fundamentals of good businesses: durability and pricing power. It puts meat on the bone of the question, “is this a truly great business that I could own for years”.
By utilizing the 7 Powers and supercharging them with the provided AI prompts, you move from being a passive consumer of financial news to an expert analyst of business quality. You begin to see the market not as a collection of ticker symbols, but as a landscape of castles (Moats) and challengers.
The next time you look at a stock, don’t just ask “Is it growing?” Ask, “Which Powers protect this growth?” If you can’t name the Power, you can use Inferential Investor’s tools to look for it. Use the prompts, run the scores, and invest in the castles.
Our free mega-prompt variant 1 (single company) follows. We simply ask that you like and restack this article in return to help us grow.
One last note: We are running the final stages of a survey to determine best practice in AI investment research. Only responders get the results. It takes 2 minutes to complete, is confidential and you will receive a 1 week complementary access to the whole prompt library in return once responses close! Whats to lose?
As always,
Inference never stops. Neither should you.
Andy West
The Inferential Investor

The 7 Powers Single Company Assessment Tool:
Variant 2: The Head-to-head 2 stock comparison tool is in the prompt library for premium subscribers.
**ROLE:**
Act as a Senior Equity Research Analyst and Strategy Consultant specializing in Hamilton Helmer’s “7 Powers” framework. Your goal is to dissect the competitive durability of **[INSERT COMPANY NAME / TICKER]** to determine if it possesses a structural economic moat.

**OBJECTIVE:**
Perform a granular analysis of the target company against each of the 7 Powers. For each Power, you must evaluate the evidence, assign a quantitative “Moat Score” (0-10), and provide a final “Total Moat Score” (0-70).

**SCORING CRITERIA (0-10 SCALE):**
* **0-2 (Non-Existent):** The company has no advantage here; it is purely competitive or commoditized.
* **3-5 (Weak/Transient):** Some advantage exists, but it is eroding or easy to replicate with capital.
* **6-8 (Strong):** Clear structural advantage that is hard to replicate; contributes significantly to margins.
* **9-10 (Dominant/Castle):** An insurmountable barrier; the defining characteristic of the monopoly.

---

### PART 1: THE 7 POWERS ANALYSIS
Analyze the company against the following. For each, provide: (1) The Thesis (Does it exist?), (2) The Evidence (Data/Examples), and (3) The Score.

**1. SCALE ECONOMIES (The “Low Cost” Power)**
* *Definition:* Unit costs decline as volume increases (e.g., fixed cost amortization).
* *Analysis:* Does the company have a cost advantage due to sheer size that smaller competitors cannot match? Look for declining COGS or Operating Expenses as a % of Revenue.
* **SCORE (0-10): [ ]**

**2. NETWORK ECONOMIES (The “Viral” Power)**
* *Definition:* The value of the service increases as new users join.
* *Analysis:* Is this a platform business? Does a new user add value to existing users? (Direct or Indirect network effects).
* **SCORE (0-10): [ ]**

**3. COUNTER-POSITIONING (The “Disruptor” Power)**
* *Definition:* A new business model that incumbents cannot copy without damaging their existing business (collateral damage).
* *Analysis:* Does the company have a model that incumbents are *afraid* to copy because it would cannibalize their profits?
* **SCORE (0-10): [ ]**

**4. SWITCHING COSTS (The “Lock-In” Power)**
* *Definition:* The value loss or pain expected by a customer if they were to switch to a competitor.
* *Analysis:* Is the product embedded in the customer’s workflow? Is there a high financial, process, or psychological cost to leaving? Look for Retention Rates (NRR).
* **SCORE (0-10): [ ]**

**5. BRANDING (The “Mindshare” Power)**
* *Definition:* The durable attribution of higher value to an objectively identical offering.
* *Analysis:* Does the company possess pricing power purely due to trust/identity? Can they charge more than a generic competitor for the exact same utility?
* **SCORE (0-10): [ ]**

**6. CORNERED RESOURCE (The “Monopoly” Power)**
* *Definition:* Preferential access to a coveted asset that ultimately drives distinct value.
* *Analysis:* Do they own a patent, a data set, a talent pool, or a regulatory license that no one else can legally or physically get?
* **SCORE (0-10): [ ]**

**7. PROCESS POWER (The “Complexity” Power)**
* *Definition:* Embedded company organization and activity sets which enable lower costs and/or superior product.
* *Analysis:* Is the company efficient due to a complex, opaque internal process that is hard to copy even if you see it? (Rare: Toyota Production System is the classic example).
* **SCORE (0-10): [ ]**

---

### PART 2: THE VERDICT & BENCHMARKING

**1. TOTAL MOAT SCORE:**
Sum the scores above (Maximum 70).
**TOTAL: [  ] / 70**

**2. THRESHOLD ANALYSIS:**
Compare the Total Score against the following benchmarks:
* **< 15 (No Moat):** A commodity business. Highly vulnerable.
* **15 - 25 (Narrow Moat):** Likely has 1-2 decent powers, but lacks durability.
* **26 - 40 (Strong Moat - “The Investable Zone”):** The company possesses at least one “Castle” power (9-10) or multiple strong powers. This is the threshold for a highly resilient portfolio compounder.
* **> 40 (Legendary/Global Dominance):** Rare air. Companies like Apple, Google, or Visa.

**3. CONCLUSION:**
* Does this business meet the “Investable Zone” threshold (>26)?
* Which specific Power is the “Load Bearing” power (the one that holds up the valuation)?
* What is the primary “Mitigant” or risk to that specific power?
* *Benchmarking:* Compare this company’s profile to a classic 7 Powers example (e.g., “This profile resembles Netflix’s Scale/Counter-Positioning mix” or “This resembles Oracle’s Switching Cost dominance”).

**4. FINAL RECOMMENDATION:**
Based *strictly* on business model durability (ignoring current valuation), is this a “Long-Term Compounder,” a “Fade Risk,” or a “Trap”?