Risk-On / Risk-Off: Equity Risk Regime Monitor April 21 2026
What are the movements in macro sensitive equities telling us about markets?
The following report was generated with the Equity Risk Regime workflow from the professional prompt library on The INFERENTIAL INVESTOR. Subscribe to access these tools and stock research.
Important Disclaimer: The following stock discussion and analysis is subject to The Inferential Investor’s Disclaimer. It is an indicative and educational exploration of advanced techniques for AI in investment research and does not make or imply any investment recommendations in any security mentioned.
Introduction
The Inferential Investor has been silent for a few weeks as we work on a really exciting project that will become available to all in time. I won’t say much yet, but this will change the way you research and invest as it will be a fully agentic investment research service backed by the institutional grade workflows and techniques we’ve been developing for over a year. Stay tuned for future announcements.
Below I introduce a new workflow that will be a regular weekly published feature report from here - the Risk-On / Risk-Off Monitor (to be added to the prompt library shortly). This workflow examines relative movements in macro sensitive securities and pairs, to synthesize implications for how the market is shifting money. It takes an evolution approach to create timely signals - examining market patterns for changes in the most recent trading sessions from how markets have been behaving prior. As we know large scale money movements drive prices and returns. In a geopolitically charged environment like we have, this becomes crucial intelligence.
Let me know your feedback on this report and share it around. I’ll keep improving it over time and if you have suggestions, I’m always open to hear them in the comments or DMs.
MARKET RISK REGIME ANALYSIS
Cross-Asset Signal Map | April 22, 2026
Executive Summary
The Regime: Ceasefire Fears - Transitional Stagflation Risk — Momentum Exhaustion Phase
Core Narrative
The prior week’s equity rally was a momentum-driven bet on a geopolitical off-ramp — the TACO trade in its purest form. The 13% rally from late-March lows was extraordinary by any metric, and the market ran well into overbought territory (RSI 73-74 on S&P and NDX) by April 17.
The last two days represent the first serious challenge to that bet. The Strait of Hormuz remained effectively closed Monday despite Iran’s Friday declaration of re-opening, the ceasefire expires Wednesday, and Trump has reiterated the naval blockade stays regardless. The Monday -0.4% pullback in equities with oil +5-6% was remarkably muted given the magnitude of the escalation — which tells us either that (1) the TACO trade is deeply entrenched and the market still believes in resolution, or (2) there is institutional buying supporting equity dips that will eventually exhaust itself.
Tuesday’s partial stabilization (Brent easing, Iran signaling dialogue participation) is an intermediate-term resolution signal, and Polymarket was pricing ~80% odds of a new S&P all-time high by April 24 as of early Tuesday — consistent with the bull case that Wednesday peace talks deliver a deal.
The critical fork: If the ceasefire extends and the Strait re-opens, the regime reverts to risk-on cyclical growth — QQQ, SMH, IWM, XLF, likely outperform and defensives and gold underperform. If it collapses, the regime shifts to stagflation bear — tech/growth underperform, energy, USO, TIP (relative to TLT), XLP, XLU, and VIX outperform. The dollar call is ambiguous in either scenario given the reserve currency credibility concerns developing in parallel. As always, betting on geopolitical outcomes is inherently unpredictable and can generate sharp swings in either direction.
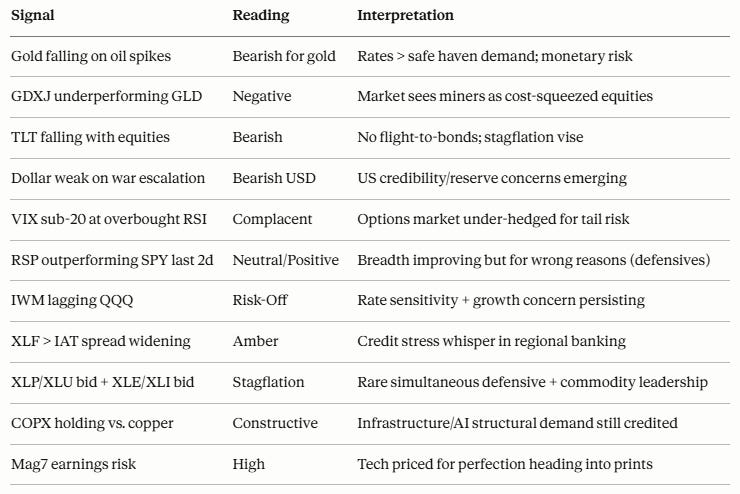
What the Pair Trades Are Telling You Right Now
GLD (Gold) underperforming oil (USO/DBC): Market sees energy inflation, not monetary chaos — yet. If the Fed falls behind the curve (already at 99% hold probability), this pair could violently reverse as gold reprices a policy error.
GDXJ (Gold Miners) lagging GLD: Energy costs crushing miner margins — only buy GDXJ if you believe peace deal is imminent (oil collapses, gold holds).
COPX (Copper Miners) outperforming copper: The structural AI/electrification trade is insulated from the conflict — a constructive read on long-term risk appetite.
IWM (Small Caps) lagging QQQ (Large Cap Tech): Sustained rate-hold environment punishes small-cap debt-heavy issuers. Don’t chase IWM until rate cut probability firms.
XLF (Financials) outperforming IAT (Regional Banks): The big banks are benefiting from this volatility; regional banks are absorbing it. Stay up the quality curve in financials.
XLP (Staples) and XLU (Utilities) bid simultaneously with XLE (Energy): This mainly happens in stagflation. It is the market screaming that it does not know whether to protect itself against inflation or growth shock deflation — so it does both.
Near-Term Catalysts to Watch (April 22-30)
Wednesday ceasefire deadline — binary event; the most important single variable
Mag7 earnings inbound — TSLA Wednesday; MSFT, GOOGL, META, AMZN on super Wednesday 29th.
FOMC April 28-29 — Fed press conference will be closely watched for any signal of a framework shift given the stagflation setup
10-year yield trajectory — if it breaks above 4.5%, TLT suffers and growth stocks face a potential technical de-rating
The equity risk regime as of this morning is best characterized as fragile optimism at technical extremes, with the dominant tail risk being a failed ceasefire catalyzing a repricing of the “peace premium” baked into the S&P at 7,064. That premium is approximately 400-500 index points (the recovery since late March) — and it has not yet been durably tested.
Market Backdrop: Two Distinct Regimes in One Week
The past seven sessions have bifurcated cleanly into two distinct risk micro-regimes, separated by a single ceasefire headline on Friday, April 17, and then partially reversed by renewed hostilities over the weekend of April 19-20. Understanding this requires tracking the driving variable — the Strait of Hormuz — rather than treating the market as a monolithic entity.
Prior Week (April 13-17): “TACO Trade” Risk-On Surge
The S&P 500 notched a record closing high of 7,022.95 on April 15, surpassing its prior peak from late January, fueled by investor optimism over potential de-escalation in U.S.-Iran tensions and renewed momentum in AI-driven tech stocks, with the index gaining 3.6% on the week. By the end of the week, the S&P 500 surged to a record intraday high of 7,147.52 on April 17, closing at 7,126.06, fueled by a 13% rally from late-March lows.
The catalyst mechanism: investors have been conditioned to believe that President Donald Trump will back off if the economic pain becomes too intense — the so-called “TACO” trade, shorthand for “Trump always chickens out.”
Last Two Days (April 20-21): Reality Check, But Not Capitulation
Investors grew cautious, sending stocks down about 0.4% in early trading while crude soared 5% from Friday’s one-month depths. Tensions escalated Sunday after President Trump said the U.S. had fired on and seized an Iranian ship. U.S. equities have rallied on the belief that the U.S.-Iran war will be resolved soon — however, with such a positive picture priced in, there is risk if reality starts to contradict that bet. By Tuesday April 21, Brent crude slipped below $95 per barrel, trimming gains from the prior session following reports that Iran will send a delegation to Islamabad for a second round of negotiations with the U.S. before the current two-week ceasefire expires.
Cross Asset Dissection
🛢️ OIL & ENERGY: central to the current regme
USO / WTI / Brent — this is the central driver of the entire cross-asset framework. WTI crude oil futures surged more than 5% to $88.8 per barrel on Monday, after an 11.5% plunge on Friday, capturing the violent oscillation between the ceasefire optimism of Friday April 17 and the weekend re-escalation. The prior week saw oil retreat sharply as ceasefire hopes built — the Friday alone saw Brent fall ~9% to $90.38. The two-day reversal (+5-6%) retraced roughly half that weekly gain.
IXC (Energy Equities) — energy stocks have decoupled partially from the commodity in an important way. Energy stocks are winning 2026, as investors find a haven in energy as betting on tech gets trickier. The energy equity sector has been the top-performing sector YTD, consistent with an inflationary supply-shock regime. Importantly, energy equities were more muted on the Monday selloff than crude itself — the market is pricing in structurally higher oil prices even after resolution, not just the spot risk premium. This is a subtle bullish divergence for energy equities relative to oil.
🥇 GOLD vs. GOLD MINERS: Inflation Effects
GLD (Gold Spot) — gold fell to 4,782 USD/troy oz on April 21, down 0.81% from the previous day. Over the past month, gold’s price has risen 8.48%, and is up 43.33% compared to the same time last year. However, the key dynamic is the directionality shift: gold dropped as much as 2% before paring some losses to trade around $4,800 an ounce on Monday, giving back gains from the previous week as renewed hostilities in the Strait of Hormuz drove oil prices sharply higher, intensifying inflation concerns.
This is a critical signal. Gold is being sold when oil rises — the opposite of classic “flight to safety” behavior. Why? The Middle East conflict has triggered a historic energy supply shock that heightened inflationary risks and raised the likelihood of central bank rate hikes, which weighed on gold. The precious metal remains down more than 8% since the Iran war began. Gold is trapped in a stagflationary vice: oil spikes raise real rates expectations (bad for gold), but the war itself isn’t triggering traditional monetary flight to gold because the Fed can’t cut into oil-driven inflation.
GDXJ (Junior Gold Miners) — the key relative read here is that miners are exhibiting negative leverage to spot gold, i.e., they are underperforming bullion. In the prior week’s rally, gold rose ~0.8%; GDXJ should have gapped ~2-3x that if it were a conventional leverage play. The underperformance signals that the market is applying a cost structure discount — higher energy costs (the miners’ largest input) are squeezing margins even as gold rises modestly. This is a bearish miner signal: GDXJ/GLD ratio compressing = the market sees gold miners as cyclical cost-pressured equities, not pure gold leverage. Risk appetite toward the speculative end of the gold complex is poor.
🔴 COPPER & COPPER MINERS: Growth vs. Supply Story Divergence
Copper (via COP/HG) — copper has been in a different regime from oil entirely. The COPX ETF had a total return of 145% in the past year, including dividends. But the most recent two days tell a different story: copper is pulling back modestly as growth concerns from the conflict (IMF cutting global growth forecasts) temper the structural electrification/AI demand narrative. Copper is fundamentally a growth metal — when stagflation risk rises (oil up, growth down), copper weakens.
COPX (Copper Miners) — as of April 19, COPX was trading at $87.19, with its 52-week range spanning from $35.90 to $99.99 — implying the miners have nearly tripled from their lows. The spread between COPX performance and pure copper prices tells us miners have been getting an equity premium from the AI/electrification narrative, which the market still credits even amid the conflict. However, the same energy cost pressure that is squeezing GDXJ is a latent risk to COPX. Over the last two days, COPX has held better than spot copper — a sign that institutional money is treating copper miners as a structural infrastructure play rather than a pure commodity trade. This is a modestly positive divergence and suggests retained risk appetite in the industrial metals space, contrasting with the more negative read in gold miners.
📉 TREASURIES: In an Inflation Vise
TLT (Long-Term Treasuries) — this is one of the most telling indicators of regime. The 10-year Treasury yield closed at 4.24% Friday, still up year-to-date, before climbing today on new geopolitical tensions. TLT is therefore falling as equities are also under pressure from renewed oil tension — a “risk-off but no flight to bonds” setup. This is the classic stagflation signal. Bonds are not working as an equity hedge.
“Rates are likely to remain elevated even if the situation in the Middle East is quickly resolved,” said Cooper Howard at SCFR. “Yields have moved up due to concerns that higher oil prices will translate to higher inflation. Even if the situation quickly resolves, it’s likely that oil prices will stay higher than they were pre-war, thus supporting higher longer-term yields.”
SHV (Short-Term Treasuries) — near-zero rate expectations for the Fed have been repriced aggressively. As of early Monday, chances of a rate pause at the Fed’s meeting this month stood at 99%, according to the CME FedWatch Tool. Odds of at least one rate cut this year are around 40%, down from 50% Friday. SHV is therefore essentially a cash proxy — the market sees no near-term easing, making the front end a carry destination rather than a safety flight destination.
TIP (TIPS) — TIPS have been under pressure in a counterintuitive way: while realized inflation is rising (headline CPI hit 3.3% YoY per recent data), real yields are rising faster as nominal yields spike on oil fears. This is another stagflation signal — the inflation compensation baked into TIPS is not keeping up with the rate-hike pricing. The TIPS/TLT ratio compressing signals that the market is pricing a growth recession scenario more than a pure inflation scenario. Watch this pair carefully — if TIPS outperform TLT into year-end, it signals a stagflation repricing is finally feeding through.
💵 US DOLLAR INDEX (DXY): Not Really a Safe Haven
The DXY is trading around 98.06-98.26, near a key support zone at 97.8-98.0. The dollar has been weakening vs. the euro and yen in the two-day period, which is an unusual signal. Normally, a risk-off event (oil spike, war escalation) drives dollar strength. Instead, the dollar is under pressure because: (1) the Fed is on hold and may be behind the curve on growth slowdown, (2) the US is the belligerent in this conflict — not a neutral safe haven — and foreign holders of US assets are modestly de-risking, (3) the euro and yen are absorbing flight-to-quality flows from investors questioning dollar reserve status.
Havens that performed well during last year’s turmoil — including gold, the yen, the euro and government bonds — failed to shield investors during the latest oil-driven volatility. The U.S. dollar appears as the closest thing to a reliable refuge, though even that signal may be overstated. UBS noted that the greenback’s strength at the onset of the Middle East conflict appeared partly driven by a positioning washout rather than pure flight-to-safety demand.
A weak dollar co-existing with rising oil and weak equities is the textbook stagflation dollar signal from the 1970s. This is a medium-term bearish dollar regime indicator.
📊 VIX: Complacency Signal
The VIX closed Monday April 21 with a prior close of 18.87. Today’s reading has ticked up to ~19.78 per Yahoo Finance data. Prior week, the VIX was compressed well below 20 as the market rallied to all-time highs. The critical observation: the RSI for both the S&P 500 and the Nasdaq 100 finished last week at 73 and 74, respectively — with a 70 RSI level generally considered overbought.
The VIX at sub-20 with overbought RSI readings and a ceasefire that is actively breaking down is a dangerous complacency reading. The options market is not adequately hedging tail risk. This is a short-volatility regime that is vulnerable to a spike if negotiations collapse at Wednesday’s ceasefire deadline. VIX term structure is likely in backwardation (near-dated elevated vs. long-dated), consistent with event-driven rather than structural risk concern.
📈 EQUITY INDEX CROSS-READS: Breadth and Factor Analysis
SPY vs. RSP (Equal Weight S&P 500): The prior week’s rally was heavily concentrated in mega-cap tech, with the equal-weight S&P 500 (RSP) lagging SPY significantly. Not a single large-cap sector had made a record high in this comeback, either intraday or on a closing basis — a warning sign that the rally’s foundation is narrower than the headline number suggests. In the last two days, RSP has held relatively better than SPY because defensive and cyclical sectors (energy, staples, materials) are outperforming growth/tech. This RSP/SPY reversion is a regime change signal within equities — the breadth rotation is underway.
QQQ (Nasdaq 100) vs. IWM (Russell 2000):
QQQ has been the prior-week leader but is now the primary pullback candidate as overbought tech meets earnings risk from the “Magnificent Seven.” All eyes are on mega-cap tech earnings, with Tesla the first Magnificent Seven stock to deliver results.
IWM at ~$269-270 has lagged QQQ during the prior-week rally, reflecting small-cap sensitivity to higher rates (variable rate debt) and domestic growth concerns. Jefferies lowered its 2026 earnings growth expectations for small and mid-cap stocks to 11.5% from 13.5%, citing surging oil prices and a widening earnings growth gap. In the last two days, IWM is underperforming the large-cap indices as the rate-hold environment continues to penalize the rate-sensitive small-cap universe. The IWM/QQQ ratio is in a steady downtrend — a risk-off within equities signal.
Value (VLUE) vs. Growth (VUG): The multi-week trend has been growth/tech outperformance driven by AI narrative. However, the last two days are seeing modest value outperformance as energy, materials, and financials (all value-tilted sectors) hold better. This is early-stage rotation rather than a confirmed trend break, but consistent with the stagflation risk regime.
Quality (QUAL) vs. Momentum (MTUM): Momentum has been dominated by tech/AI names and will face a sharp correction if tech earnings disappoint. Quality — which emphasizes low debt, high margins, consistent earnings — should outperform in the current environment given rising rates making leveraged balance sheets expensive. Watch for QUAL/MTUM spread widening in the week ahead.
🏦 FINANCIALS & REGIONAL BANKS (XLF vs. IAT)
XLF (Large-Cap Financials): After JPMorgan Chase, Bank of America, and other big banks reported stronger profits than analysts expected for Q1 2026, analysts have even raised their profit expectations since the war began. XLF has been a relative outperformer in the prior week, benefiting from strong earnings, rising net interest margins (higher for longer), and strong capital markets activity. The big banks are effectively profiting from volatility.
IAT (Regional Banks): This is where the risk-off signal is most concentrated. Regional banks are caught between two headwinds: (1) higher long rates squeezing unrealized bond portfolio losses (echoes of 2023 SVB dynamic), and (2) smaller cap/domestic growth exposure. IAT has consistently lagged XLF throughout this period — the XLF/IAT spread widening is a credit risk appetite indicator flashing amber. Regional banks are a leading indicator of credit stress, and their relative underperformance warrants monitoring.
🛡️ DEFENSIVES: Sensitive to Ceasefire Outcomes
XLP (Consumer Staples), XLU (Utilities), IHF (Healthcare): The prior week saw these sectors lag badly as the growth/risk rally emerged. However, in the last two days, defensives are outperforming as the momentum reversal bites. This is consistent with end-of-week overbought conditions forcing money into defensive positioning ahead of the ceasefire deadline.
Consumer Staples (XLP), Industrials (XLI), Materials (XLB), and Energy (XLE) are Leading in momentum terms, while Technology (XLK), Communications (XLC), Consumer Discretionary (XLY), and Financials (XLF) are Lagging. Note the unusual combination — defensive XLP is Leading alongside cyclical/inflationary XLI and XLE. This is not a clean “risk-on” or “risk-off” signal but rather a stagflation sector rotation: both inflation hedges (energy, materials) AND defensives (staples) are bid simultaneously, while growth (tech, discretionary) and credit (financials) are offered.
XLI (Industrials): Holding relatively well due to the AI infrastructure/defense spending narrative and reshoring themes that are independent of the Iran conflict. This is a bullish structural divergence within the cyclical space.
🖥️ TECHNOLOGY: Priced-for-Perfection Heading into Earnings
IXN/SMH (Tech & Semiconductors): Semiconductors have been the alpha generator of the 2025-26 cycle. Investors’ enthusiasm for artificial intelligence and technology stocks, which account for almost half of the S&P 500’s market capitalization, is running “on its own dynamic independent of anything, including the war in Iran.” SMH at current levels is extended and now faces a direct challenge: Mag7 earnings begin this week. If guidance disappoints or capex is cut, SMH faces a violent de-rating.
The key risk: at 7,164, the S&P 500 is essentially pricing in a near-perfect outcome — betting that tensions around the Iran conflict ease quickly, the AI-driven growth story continues to deliver, and the economy manages a soft landing. This “priced for perfection” problem is nowhere more acute than in semiconductors trading at peak multiples.
🏭 MATERIALS & BROAD COMMODITIES (XLB, DBC)
DBC (Broad Commodities Index): Rising with oil but facing mixed signals. Agricultural commodities are up (conflict disruption to Black Sea and broader supply chains), energy leads, but industrial metals (copper, aluminum) are mixed on growth concerns. DBC is functioning as a hedging vehicle against inflation, not a growth proxy.
XLB (Materials Equities): Outperforming the S&P 500 YTD on a structural basis (chemicals, specialty materials benefiting from reshoring and infrastructure demand), but in the last two days showing modest softness as growth concerns from the oil shock filter through. The XLB/DBC ratio (materials equities vs. commodity prices) is the key proxy for the market’s assessment of margin sustainability — if this ratio falls sharply, it signals that commodity-input cost inflation is overwhelming pricing power.
Analysis current as of close April 21, 2026. All price levels approximate based on available data. Not investment advice.
All comments or feedback appreciated on this report format.
Andy West
The Inferential Investor