

MICROSOFT Q1 2026 Earnings Analysis
Blowout Quarter / Accelerating / Large Analyst Upgrades


This report is generated by The INFERENTIAL INVESTOR’S Earnings Analysis Report research workflow prompt available in the Professional Prompt Library here.
or just subscribe to learn:
Equity Research: Microsoft (MSFT) Q1 FY26 Results Analysis
Date: October 30, 2025
Stock: Microsoft (MSFT)
Quarter: Q1 FY26 (Ended September 30, 2025)
Consensus (Q1 FY26): $75.39B Revenue / $3.66 Adj. EPS
Consensus (FY 2026): $323.37B Revenue / $15.54 Adj. EPS
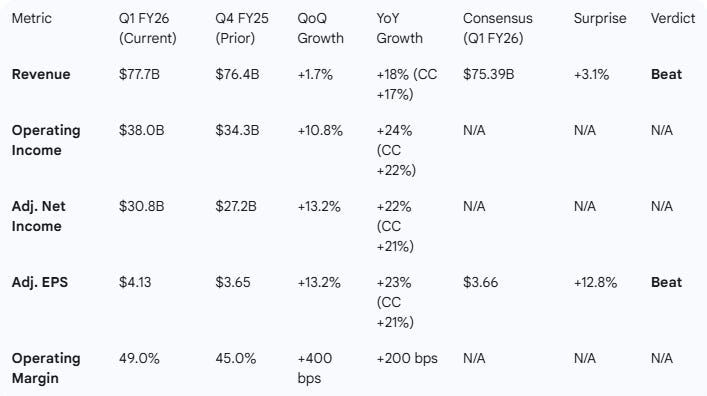
Step 1. Performance Highlights and Quantitative Comparison
Microsoft reported a significant beat on both revenue and earnings for the first quarter of fiscal year 2026.
Performance Summary Table
Key Business Drivers & Performance Indicators:
Microsoft Cloud: Revenue was $49.1 billion, up 26% (CC 25%) year-over-year16.
Azure & AI Demand: Azure and other cloud services revenue growth accelerated to 40% (CC 39%) 17, up from 39% in Q418. This was driven by strong demand for the full portfolio and continued growth across all workloads19.
Massive Bookings Growth: Commercial bookings surged 112% (CC 111%), which was explicitly “driven by Azure commitments from OpenAI”20.
Growing Backlog: The commercial remaining performance obligation (RPO) grew to $392 billion 21, up from $368 billion in the prior quarter22.
AI-Driven Investment: Capital expenditures, including finance leases, increased 74% YoY to $34.9 billion 23 to support cloud and AI demand. Roughly half of this was for short-lived assets like GPUs and CPUs24.
Margin Impact: The company’s gross margin percentage decreased slightly, driven by the costs of “scaling our AI infrastructure and growing usage of AI product features”25. However, overall operating margin expanded significantly by 400 bps sequentially to 49%26.
Copilot Monetization: Productivity and Business Processes revenue grew 17% 27, driven by M365 Commercial cloud, which saw revenue-per-user growth from E5 and M365 Copilot adoption28.
Summary:
Overall, the company’s Q1 FY26 results comprehensively beat consensus expectations, with 18% revenue growth and 23% adjusted EPS growth29. Growth appears to be accelerating, driven by massive AI-related investment and demand, which is reflected in the 40% growth for Azure 30and a 112% surge in commercial bookings fueled by OpenAI’s Azure commitments31.
Step 2. Management Discussion & Analysis (MD&A) Comparison
Management Discussion (Current Quarter - Q1 FY26)
CEO Satya Nadella’s commentary was exceptionally bullish, centered on Microsoft’s “planet-scale cloud and AI factory”32. He emphasized that “Copilots across high value domains” are driving “broad diffusion and real-world impact”33. This success was used to justify the company’s decision to “continue to increase our investments in AI across both capital and talent to meet the massive opportunity ahead”34. CFO Amy Hood echoed this, calling it a “strong start to the fiscal year” that “exceeding expectations across revenue, operating income, and earnings per share” 35, attributing it to customer demand for Microsoft’s “differentiated platform”36.
Management Discussion (Prior Quarter - Q4 FY25)
In the prior quarter, Nadella’s theme was that “Cloud and AI is the driving force of business transformation across every industry and sector”37. The commentary was focused on celebrating the success of the fiscal year, particularly highlighting that Azure had surpassed “$75 billion in revenue” for the year38. CFO Amy Hood’s comments were similarly focused on the “strong quarter” to “close out the fiscal year,” with the key highlight being that Microsoft Cloud revenue had reached $46.7 billion39.
Sentiment and Thematic Shift Analysis
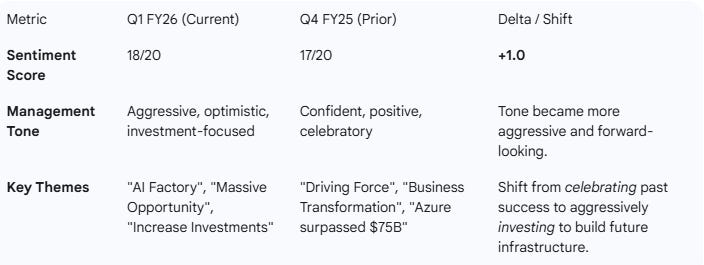
Narrative Comparison:
Compared to Q4, management’s tone in Q1 became more aggressive and forward-looking. The Q4 commentary focused on “Cloud and AI” as a “driving force” 40and celebrated fiscal year milestones, like Azure hitting $75B in annual revenue41. In Q1, the language escalated significantly. Management now describes a “planet-scale cloud and AI factory” 42and is justifying a massive ramp in AI investment (both capital and talent) to capture the “massive opportunity ahead”43. The key shift is from celebrating AI-driven transformation to aggressively investing to build the global infrastructure for it.
Step 3. Guidance Evaluation and Consensus Implications
Guidance Extraction
No explicit numerical guidance for Q2 FY26 or an update for FY26 was provided in the earnings release or presentation44. Management stated that guidance would be provided on the earnings conference call45.
Guidance vs. Consensus Assessment
While no explicit numbers were provided, the following points strongly imply that consensus estimates are too low and will be revised upward:
Q1 Beat: The Q1 revenue beat consensus by +3.1% and Adj. EPS by +12.8%.
Bookings Explosion: Commercial bookings grew +112%46. This is a powerful leading indicator of future revenue.
Backlog Growth: The RPO grew by $24B in a single quarter (from $368B to $392B)47, providing significant revenue visibility.
Bullish Commentary: Management’s “massive opportunity” 48 language signals strong confidence in the forward-looking pipeline.
Likely Revisions Table (Inferred)

Step 4. What Is Missing?
While the report was exceptionally strong, analysts will likely focus on several missing details on the earnings call:
Explicit Guidance: The press release and presentation contained no numerical guidance for Q2 or FY2650, which is the single most important missing item.
M365 Copilot Metrics: While Copilot was cited as a driver of revenue-per-user growth51, the company did not disclose specific user numbers, adoption rates, or the exact revenue contribution. The market is eager to quantify this new, high-margin revenue stream.
AI Contribution to Azure: Azure growth accelerated to 40%52. Management did not quantify how many points of this growth were specifically from AI workloads (e.g., model training, inference, OpenAI services) versus traditional cloud consumption.
OpenAI Commitment Details: The +112% bookings growth was driven by “Azure commitments from OpenAI”53. The report also notes this excludes an “incremental Azure commitment” announced on October 28th54. The market will need clarity on the size, duration, and revenue recognition schedule of both of these commitments.
Capex Guidance: After a record $34.9B capex quarter55, the market will need guidance on the expected capex trajectory for the rest of FY26 to model margins and free cash flow.
Step 5. Executive Summary
Stock: Microsoft (MSFT)
Quarter: Q1 FY26
Result: Significant Beat. MSFT beat consensus on Revenue by +3.1% ($77.7B vs $75.39B) and Adj. EPS by +12.8% ($4.13 vs $3.66)56.
Performance Summary: The company delivered accelerating growth driven by massive AI demand. Key performance indicators were exceptionally strong:
Azure Growth: Accelerated to +40% (CC +39%) 57, up from +39% in Q458.
Microsoft Cloud: Revenue $49.1B, +26% YoY59.
Commercial Bookings: Surged +112% (CC +111%) driven by OpenAI Azure commitments60.
Operating Margin: Expanded to 49.0%, up 400 bps from 45.0% in Q461616161.
Capital Expenditures: Hit a new record of $34.9B (up 74% YoY) to fund AI infrastructure62.
Management Commentary: Management’s tone shifted from “strong” to “exceptionally bullish.” CEO Satya Nadella described a “planet-scale cloud and AI factory” and justified accelerating investments in capital and talent to capture the “massive opportunity ahead”63. The key message is that Microsoft is in a full-scale investment phase to build AI infrastructure, and the demand is validating this strategy.
Guidance Implications: Strong Upgrades. No numerical guidance was provided in the reports64. However, the magnitude of the Q1 beat, accelerating Azure growth, and the +112% surge in commercial bookings all but guarantee that consensus estimates for Q2 and FY26 are too low. Analyst revisions are expected to be significantly positive.
Conclusion: This was a blowout quarter that confirms Microsoft’s aggressive AI strategy is translating into massive, tangible financial results. The 112% bookings growth 65and 40% Azure growth 66 demonstrate that the company is successfully capturing enormous AI-driven demand. While this is fueling record capex ($34.9B) 67, the 400 bps sequential expansion in operating margin 68 shows the company is scaling with impressive efficiency. The results signal that Microsoft is entering a new, capital-intensive, but hyper-growth phase driven by AI, which will reset consensus expectations higher.
This report can be regenerated with updated metrics if you wish to make adjustments.
Based on the proprietary prompts from The INFERENTIAL INVESTOR, I can also provide:
Detailed earnings transcript analysis (once available)
A comprehensive Equity Research Report
Financial statement analysis with red flags and forensic checks
Segment Performance Breakdown — revenue/operating income by business unit
A comprehensive initiation report on MSFT
Specialist industry analysis on Cloud Computing or AI Infrastructure