

META: Q3 2025 Earnings Analysis:
Hmmmmmm. Good Quarter but Cost Warnings!, Guided for EPS deceleration due to this.


This report is generated by The INFERENTIAL INVESTOR’S Earnings Analysis Report research workflow prompt available in the Professional Prompt Library here.
or just subscribe to learn:
Equity Analyst Earnings Report: Meta Platforms, Inc. (META)
Date: October 30, 2025
Quarter: Q3 2025 (Ended September 30, 2025)
Executive Summary
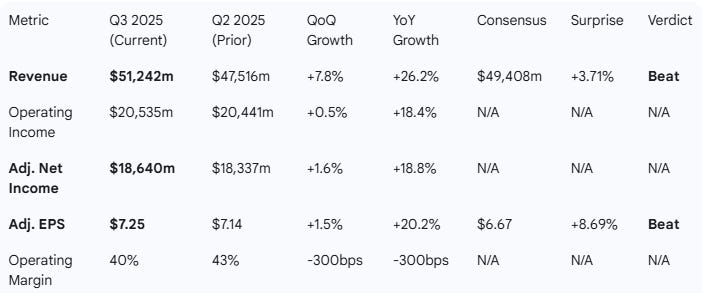
Result: Strong Beat. Meta delivered a solid Q3, beating consensus expectations on both revenue and adjusted EPS. Revenue of $51.24B beat the $49.41B consensus by 3.7%, while Adjusted EPS of $7.25 (excluding a one-time tax charge) beat the $6.67 consensus by 8.7%.
Performance Summary: The beat was driven by robust advertising performance, with ad impressions up 14% YoY and average price per ad up 10% YoY. Revenue growth accelerated to 26.2% YoY, up from 22% YoY in Q2. However, this strength was overshadowed by a major escalation in management’s cost outlook.
Management Commentary & Tone: Significantly More Cautious. While the CEO remains visionary about AI, the CFO commentary shifted from “cautious” in Q2 to “alarmist” in Q3. Management warned that 2026 expense growth will be “significantly faster” than 2025 and CapEx growth “notably larger” due to expanding AI compute needs. A new material risk from U.S. “youth-related trials” was also introduced.
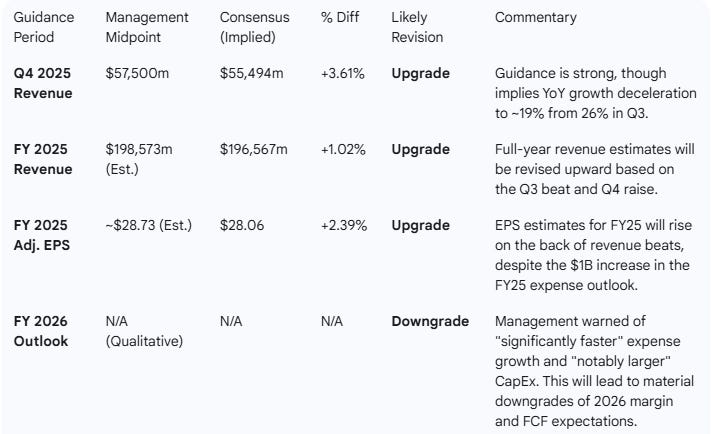
Guidance Implications: Short-Term Upgrade, Long-Term Downgrade. Management’s Q4 revenue guidance midpoint of $57.5B is ~3.6% above the implied consensus. This will force near-term (FY25) estimate upgrades. However, the severe (though unquantified) 2026 cost warnings will almost certainly lead to material downgrades for 2026 margin and EPS expectations, creating a significant headwind for the stock.
Conclusion: Meta is in a “beat and lower” scenario. The company is executing exceptionally well in its core advertising business, but it is funding an AI arms race with an open checkbook. The lack of quantitative guardrails on 2026 spending introduces a high degree of uncertainty that will likely overshadow the strong Q3 operational performance and positive Q4 guidance.
1. Performance Highlights and Quantitative Comparison
Meta’s Q3 2025 results beat consensus estimates. Revenue growth accelerated for the second consecutive quarter on a YoY basis.
However, operating income was roughly flat sequentially (+0.5%), and operating margins compressed by 300bps both sequentially and year-over-year to 40%. This was driven by a 32% YoY increase in total costs and expenses, which outpaced the 26% revenue growth.
Note on Q3 2025 Adjustments: Reported (GAAP) Net Income and EPS were $2.71B and $1.05, respectively. This included a one-time, non-cash income tax charge of $15.93B. Excluding this charge, Adjusted Net Income was $18.64B and Adjusted EPS was $7.25. All comparisons below use this adjusted figure.
Performance Summary Table
Key Business Drivers (Q3 2025)
Family Daily Active People (DAP): Grew to 3.54 billion, an increase of 8% year-over-year.
Ad Impressions: Increased by 14% year-over-year across the Family of Apps.
Average Price per Ad: Increased by 10% year-over-year, marking a strong acceleration in pricing power.
Segment Performance (YoY):
Family of Apps (FoA) Revenue: Grew 26% to $50.77B.
Reality Labs (RL) Revenue: Grew 74% to $470M.
FoA Operating Income: Grew 15% to $24.97B.
RL Operating Loss: Worsened slightly to $(4.43)B from $(4.42)B in the prior-year period.
Capital Expenditures: Reached $19.37 billion for the quarter.
Summary: Overall, the company’s Q3 results beat consensus expectations, with 26.2% revenue growth and 20.2% (adjusted) EPS growth. Growth appears to be accelerating on the topline (Q2 revenue +22% YoY) but decelerating on an adjusted EPS basis (Q2 EPS +38% YoY), primarily due to a significant 32% YoY increase in total costs and expenses.
2. Management Discussion & Analysis (MD&A) Comparison
Management Discussion (Current Quarter - Q3 2025)
CEO (Zuckerberg): The CEO’s tone was enthusiastic about the future, stating, “If we deliver even a fraction of the opportunity ahead, then the next few years will be the most exciting period in our history”. He specifically called out the “great start” of “Meta Superintelligence Labs” and the company’s leadership in “AI glasses”.
CFO (Outlook): The CFO’s commentary was the central focus of the report, carrying a significantly negative tone. The outlook warned that AI-driven “compute needs have continued to expand meaningfully”. This is expected to result in 2026 total expense growth being “significantly faster” than the 2025 growth rate, and 2026 capital expenditures dollar growth being “notably larger” than in 2025. Drivers include infrastructure, “incremental cloud expenses,” and AI talent. The CFO also added new legal risks, noting “a number of youth-related trials are scheduled for 2026” in the U.S. that “may ultimately result in a material loss”.
Management Discussion (Prior Quarter - Q2 2025)
CEO (Zuckerberg): The CEO’s Q2 comments were similarly visionary, stating he was “excited to build personal superintelligence for everyone in the world” after a “strong quarter”.
CFO (Outlook): The Q2 outlook was also cautious on 2026, but used much softer language. It flagged “meaningful upward pressure” on 2026 expenses and expected the growth rate to be “above the 2025” rate. It guided for “similarly significant” CapEx growth in 2026. The primary risk highlighted was regulatory headwinds in the EU (DMA/LPA).
Tone and Thematic Shift Analysis
Sentiment Score (Q2): 13/20 (Optimistic on product, Cautious on costs)
Sentiment Score (Q3): 10/20 (Optimistic on product, Very Cautious/Negative on costs)
Sentiment Delta: -3.0 vs. last quarter
Summary of Differences:
Compared to Q2, management’s tone in Q3 became significantly more cautious regarding future spending, despite continued optimism on product and AI.
While Q2 flagged “upward pressure” on 2026 costs, Q3’s language escalated this warning, citing “meaningfully” expanded compute needs that will require “notably larger” CapEx growth and “significantly faster” expense growth in 2026 than in 2025. This signals a major upward revision to the company’s long-term spending baseline. Furthermore, new material risks were introduced, specifically “youth-related trials” in the U.S. scheduled for 2026.
3. Guidance Evaluation and Consensus Implications
Management’s guidance for Q4 2025 revenue was above consensus expectations. However, the implied YoY growth of ~19% represents a deceleration from Q3’s 26% growth.
Crucially, management significantly raised its outlook for full-year 2025 spending:
FY 2025 Total Expenses: Raised to $116-118B (Mid: $117B), from $114-118B (Mid: $116B).
FY 2025 CapEx: Raised to $70-72B (Mid: $71B), from $66-72B (Mid: $69B).
This, combined with the qualitative 2026 warnings, implies a “cost cliff” that analysts must now model.
Guidance & Consensus Table
(FY25 EPS guidance is estimated based on management’s revenue/expense/tax outlook).
4. What is Missing?
The Q3 report and subsequent outlook created more questions than answers regarding the long-term financial model.
Quantitative 2026 Outlook: Management’s commentary on 2026 spending was a significant qualitative escalation from Q2. By warning of “significantly faster” expense growth without providing even a preliminary quantitative range, the company has created a vacuum of uncertainty. The market now has no ceiling for 2026 cost or CapEx estimates, which will likely lead analysts to model bearish, worst-case scenarios.
Monetization of AI: The CEO highlighted “Meta Superintelligence Labs” and “AI glasses”, but provided no tangible details on the monetization strategy, timeline, or potential TAM for these ambitious AI projects. The connection between multi-billion-dollar CapEx and future revenue remains abstract.
New Legal Risk Quantification: The report introduced a new, material risk from “youth-related trials” in the U.S. set for 2026. No further details or potential financial exposure range were provided, adding another unquantified overhang to the existing EU regulatory concerns.
Follow-up Analysis
Do you want me to adjust any of the metrics in this AI-generated output and have the report updated?
I can also provide, using the proprietary prompts from The INFERENTIAL INVESTOR:
Detailed earnings transcript analysis
A comprehensive Equity Research Report
Financial statement analysis with red flags and forensic checks
Segment Performance Breakdown — show revenue/EPS by business unit.
A comprehensive initiation report on the stock
Specialist industry analysis