

The image above is AI generated to encapsulate the idea of what Meta could be facing in the absence of a Meta Compute launch…
The following report was generated with the assistance of background research conducted by Inferent Analyst’s agentic intelligence workflows. Subscribe to keep informed of this unique project.
Why is Meta looking to launch Meta Compute now?
We’re constantly told about a Compute shortage. AI demand exceeds supply. There’s not enough memory to go around, not enough data center capacity in operation yet, not enough optics, not enough CPUs. Given the surging demand for AI, particularly from enterprises that is quantitatively demonstrated in the revenue growth rates of companies like Anthropic, OpenAI, DeepSeek, Moonshot and via cloud divisions like Google Cloud, AWS and Azure, then…
Why would Meta look to rent out its compute?
This article clearly answers that question.
First a quick bit of history. Nearly a year ago, I demonstrated a forensic financial statement analysis technique using AI and Meta as the example and showed why we should expect downgrades, a sharp earnings slowdown for the company, with the multiple and share price to fall. That has played out largely as I anticipated and wrote about at the time. Meta has been a standout AI alpha short over the intervening period compared with the sector. This older article is linked here for reference.
In the wake of the recent Q2 results I have updated my analysis of Meta using a new technique. The prompt I use for this is copied at the bottom of this post for free, along with a downloadable analysis of Meta. Essentially this workflow analyzes trends in line items of the financial statements and the notes to accounts and identifies the leading items, correlating them with forward growth projections for revenue and earnings.
This and many other workflows are being engineered into Inferent Analyst so investors can receive this type of insight agentically, without having to do anything other than listing a stock in their watchlist…If that sounds like something you may be interested in, I encourage you to pre-register using the link below and get on the shortlist for launch when development is finished.

Let me introduce you to Inferent Analyst - a cutting edge AI investment research platform being developed by investors - for investors. Inferent Analyst is designed to be every investor’s autonomous equity research assistant. No more pages and pages of raw numbers without context like traditional data terminals. Inferent Analyst actually interprets and analyzes the data automatically, as events unfold, presenting you with the insights you need to discover ideas and make better investment decisions. Pre-register today as subscriber seats will be limited on launch.
Meta’s Advertising Revenue Growth is Set to Slow Sharply
At the bottom of this section I have provided a downloadable PDF with the forward looking analysis of Meta’s financial statements. Its an illuminating read as it provides all the detail behind the trends I highlight now. It is this analysis that prompted me to investigate Meta’s forward growth outlook using a 2-year stack technique. A 2-year stack analysis allows an investor to highlight the impact of cycling past comps (prior year growth rates). At times of cycling low comps, a stock can experience a growth tailwind which boost the multiple and stock price. At other times, like now for Meta, it provides a serious headwind.
Meta’s revenues are primarily driven by advertising and in turn advertising revenues are a product of Ad impressions and Ad price. Growth in these drivers are cyclical and regularly go through periods of acceleration and deceleration and this gets reflected in Meta’s multiple and share price. In Meta’s Jun quarter earnings report we saw Advertising revenue growth slow sharply from 33% year-on-year in the March quarter to 27.7%. The stock reacted negatively to this development. Why?
Ad pricing
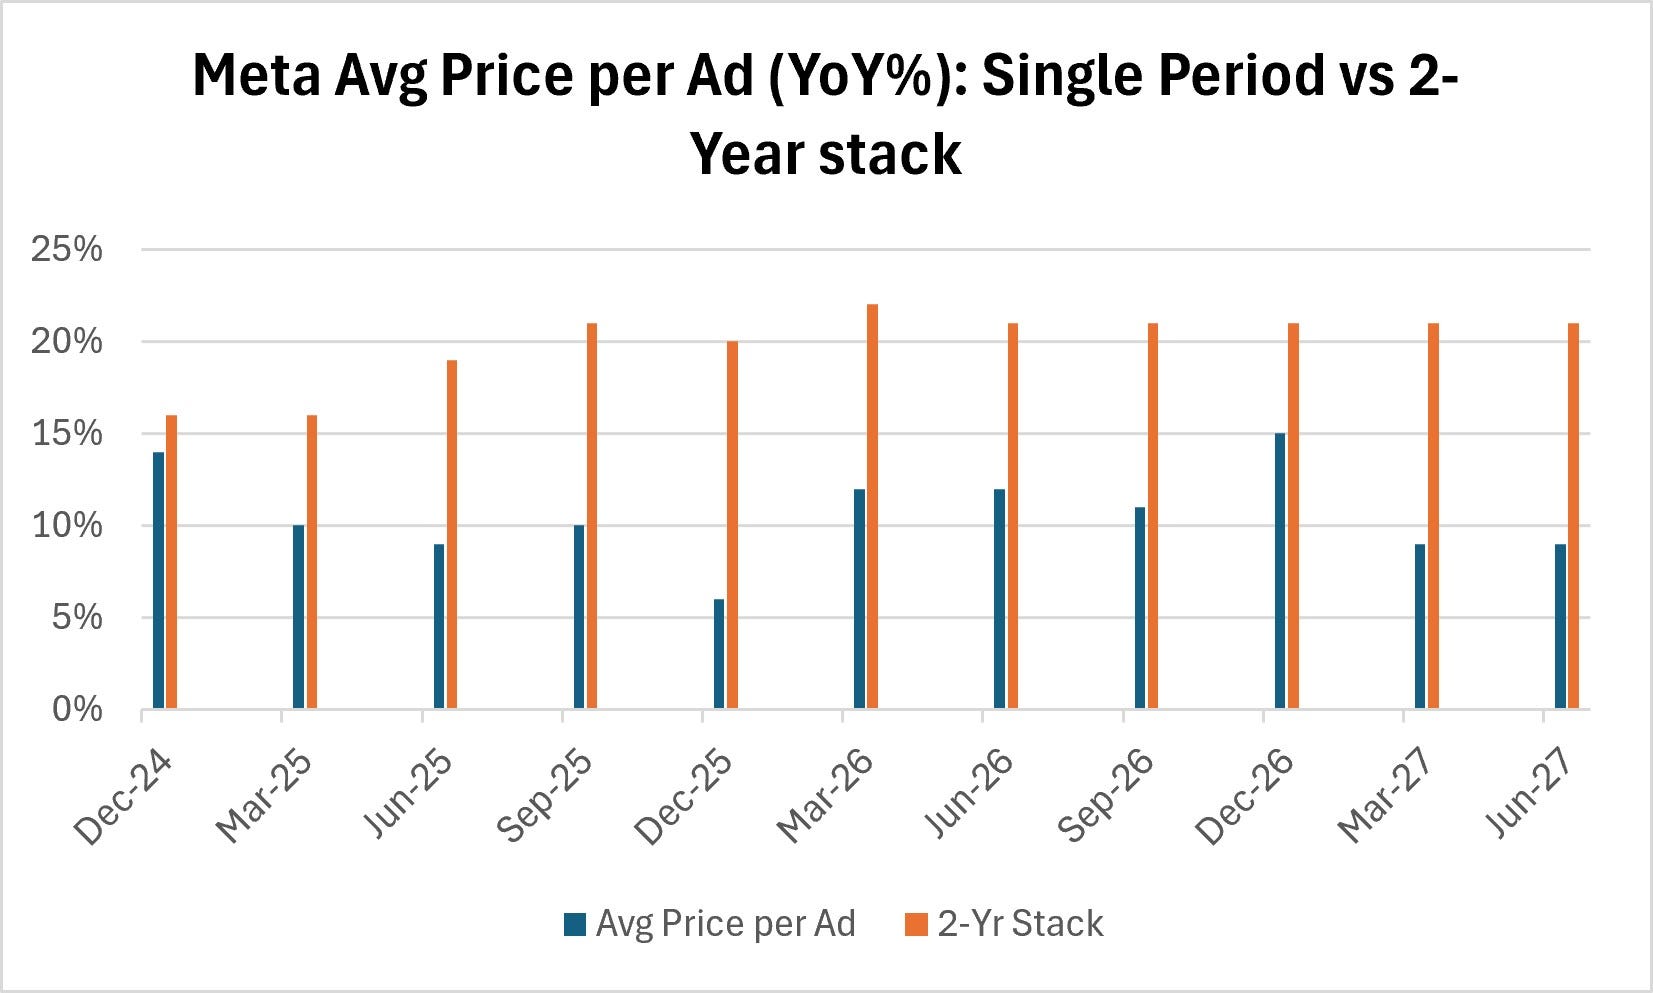
The chart above shows the YoY growth in Average Ad Pricing for Meta since the Dec-24 quarter up till the most recently reported Jun-26 quarter with 2 metrics:
a. The single period growth rate (YoY%) in blue; and
b. The 2 year stack growth rate in orange
Thereafter the chart builds a base case ad pricing growth scenario based on a simplifying assumption of constant 2-year stack growth. That is, the 2-year stack growth rate that was achieved in the June quarter is assumed to be constant going forward. A single period YoY growth rate can then be implied from that as we already know the growth rate 1 year ago. Hence the base case scenario in each subsequent quarter is then just the difference between that and the constant 2 year growth assumption. This is a technique that is often very useful for forecasting comp growth rates for consumer discretionary stocks over short horizons (< 1 year).
The analysis of Ad pricing shows a gradual slowdown trend out to Jun-27 with a slight growth bump in the Dec-26 quarter as Meta cycles the weaker Dec-25 growth rate. Notwithstanding that bump, Ad pricing growth has an underlying deceleration bias from 12% pa in Jun-26 Qtr to 9% pa by Mar-27.
Ad Impressions - where the rubber hits the road
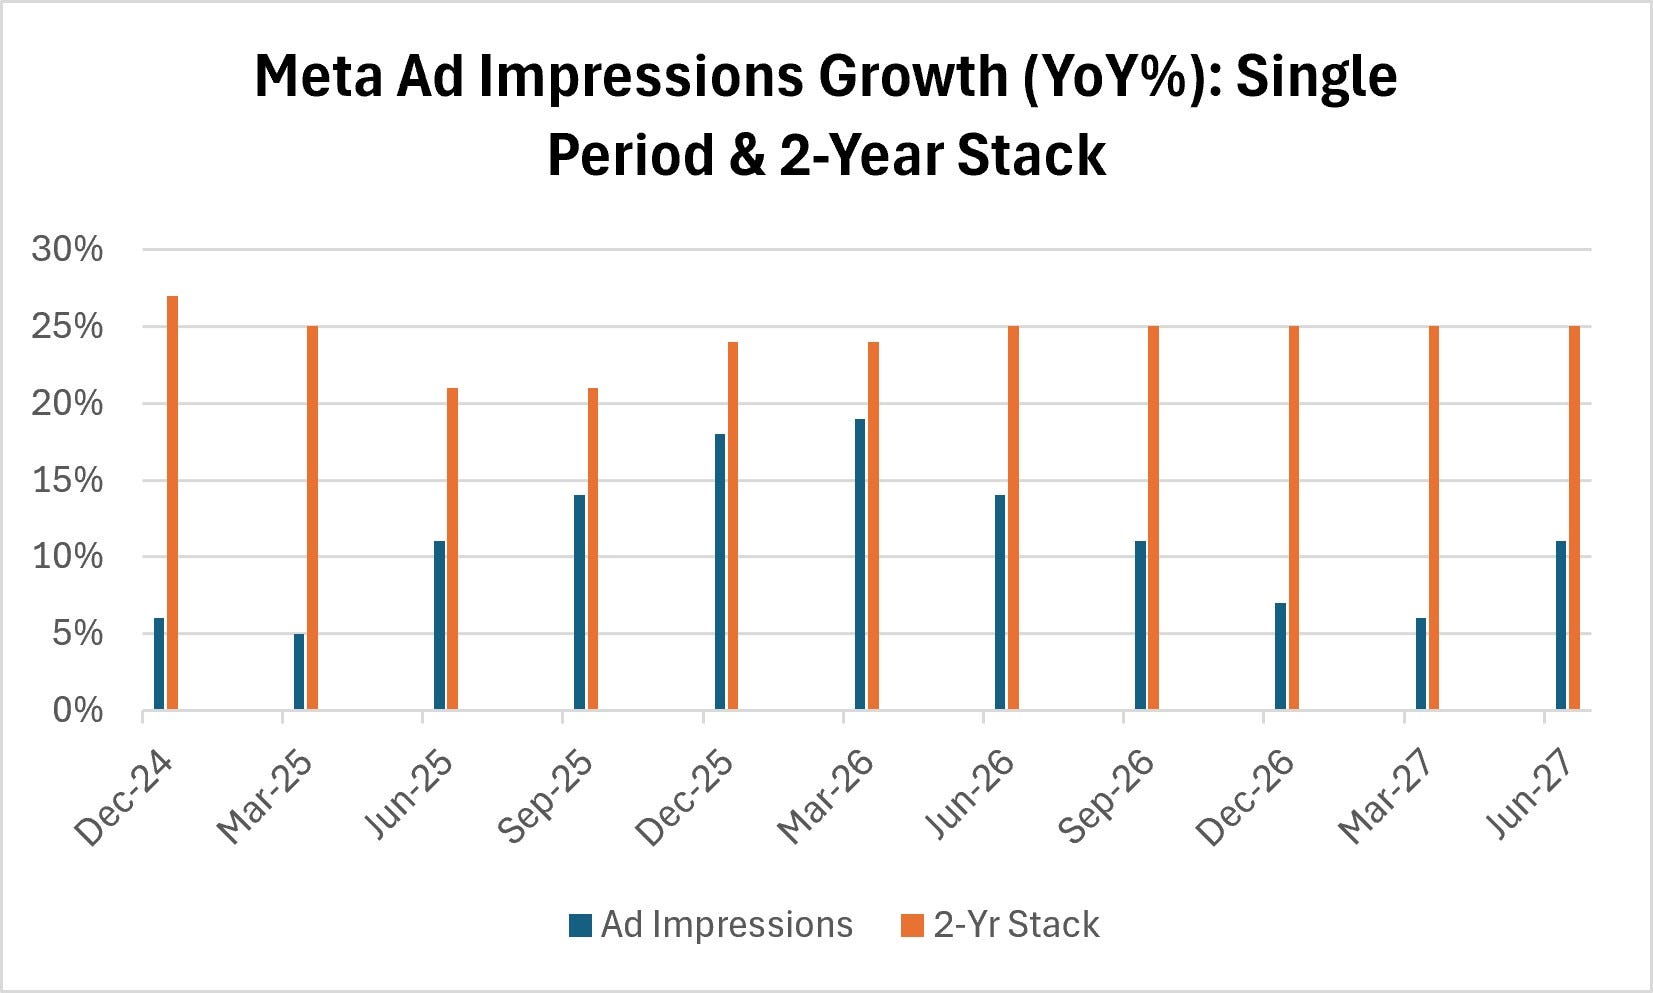
This is where Meta is facing the real pressure. Single period Ad impression growth shown in the blue columns accelerated from Mar-25 to Mar-26. What we then saw in the June quarter earnings report where revenue growth started to slow, was a peak and deceleration in Ad impressions commence. Note however that the 2-year stack (orange) has been virtually flat for the last 3 quarters. If we extrapolate that out, just like for Ad pricing, we can construct a simple base case scenario for future quarters.
Under that constant 2-year stack assumption, we see in the blue columns that Ad impression growth is likely to decelerate sharply from 19% in the Mar-26 quarter to only 6% in the Mar-27 quarter as it cycles that prior peak growth.
Put those drivers together and this is what you get:
Meta Advertising Revenue Growth Scenario
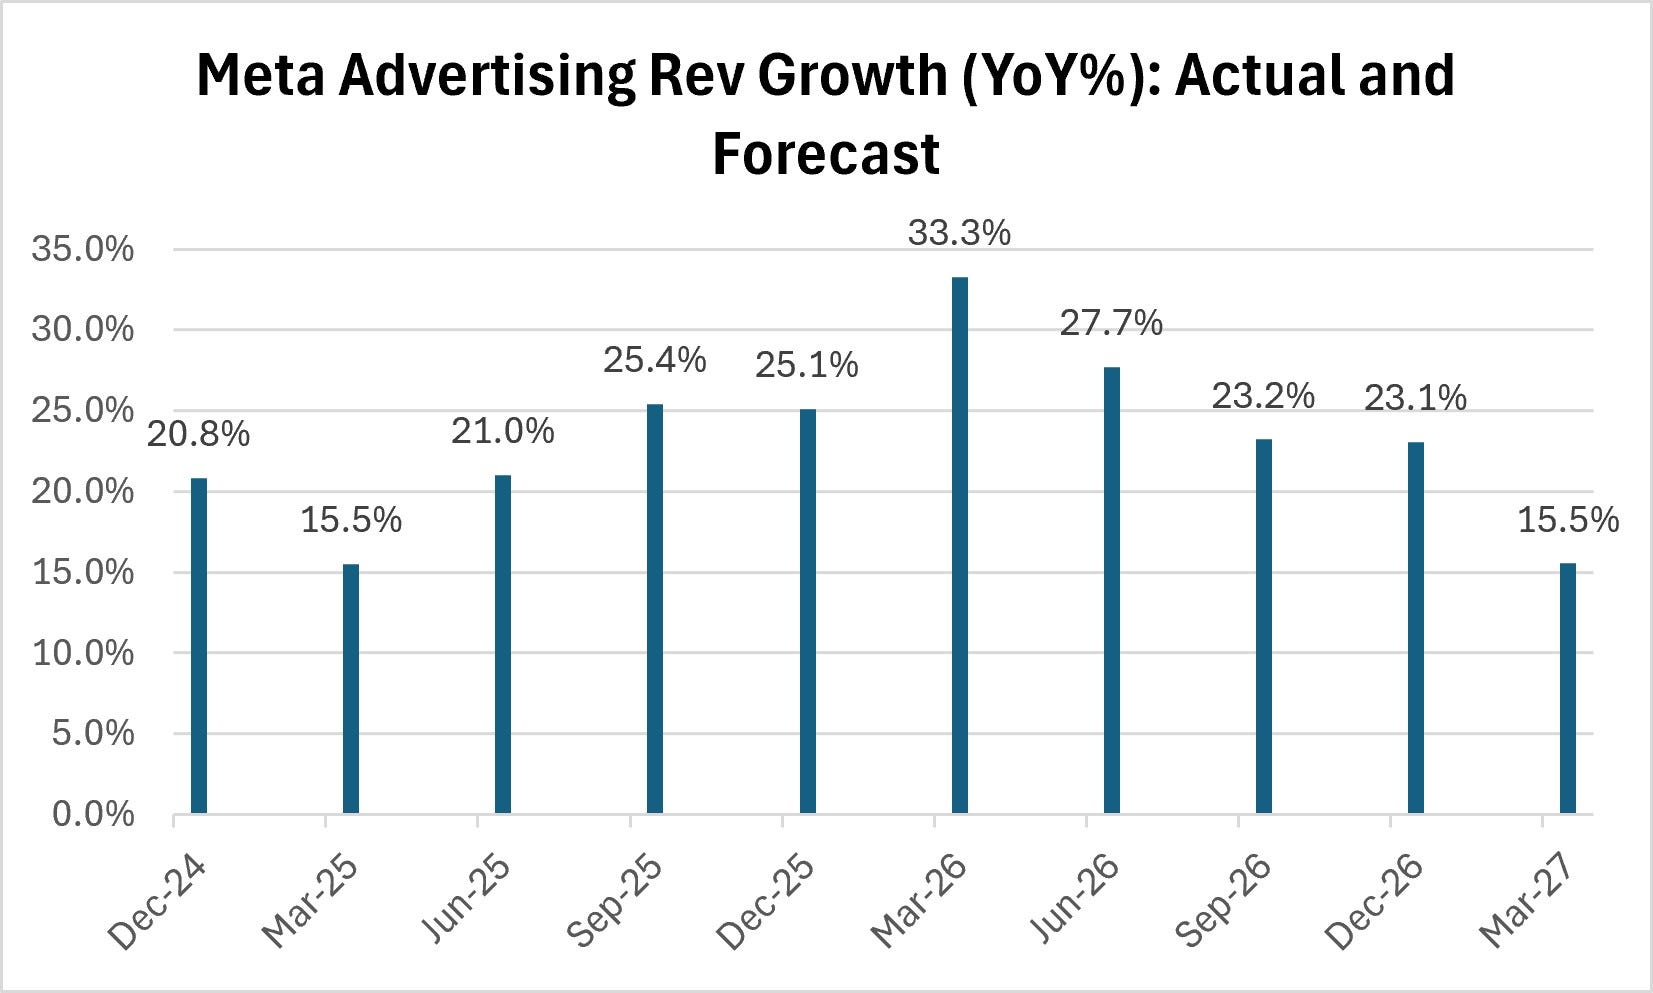
This analysis demonstrates that due to cycling strong comps that peaked in Mar-26, Meta’s underlying advertising revenue growth rate is likely to slow from 33% pa to only 15% by the Mar-27 quarter. Analysts have NOT modeled that yet. Consensus is still assuming 20% revenue growth in that quarter that is potentially cum downgrade in my view. That 5 percentage point growth difference represents $3.5bn of revenues in that quarter or an annualized $14bn revenue hole. The market will not like that as Meta’s Opex growth continues to run between 30% and 40% pa putting extreme pressure on their EPS growth.
This is why Meta needs Meta Compute revenues in the near term.
Meta Compute’s Importance
The clock is ticking on Meta generating significant revenues from its Compute division that is still unquantified as to timing or magnitude. It is one of the reasons we are seeing an accelerating cadence of Muse Spark model releases as both compute rental to other AI leaders and model serving are foundations of how Meta will try and minimize that gap.
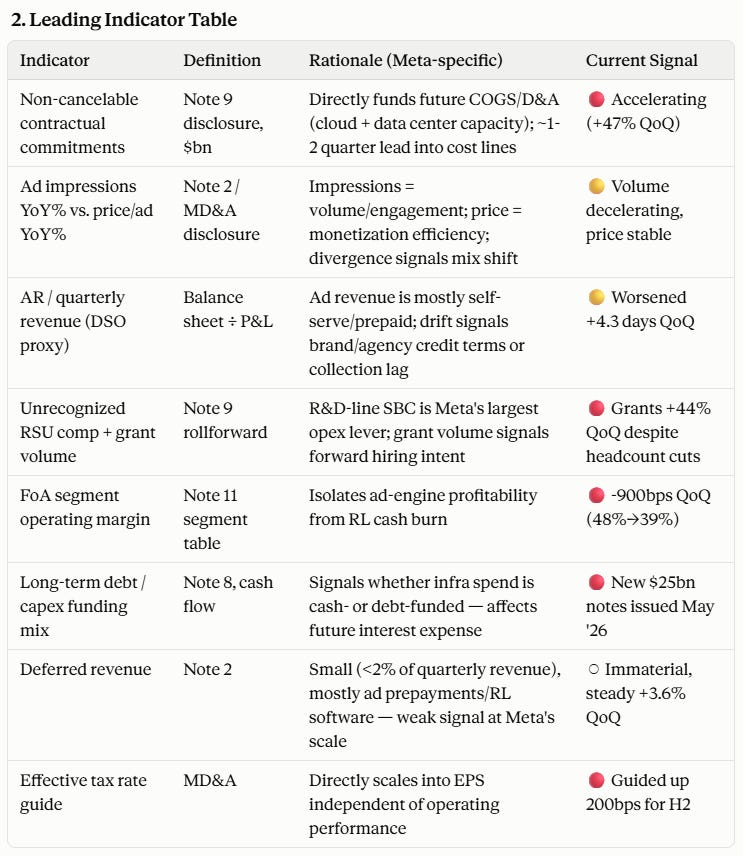
The leading indicator table that the Inferent workflow isolates from Meta’s financial statements highlights both the revenue and opex headwinds. The full version of this report is attached.
Non-cancelable contractual commitments which drive COGS, D&A and operating expenses are accelerating even as underlying revenue growth slows. This is set to continue to impact the operating margin. Meta must build the fully fitted data center capacity in order to be able to rent it. However, it can take 3 years for capacity to go from concept to commissioning.
Meta is essentially threading the eye of the needle. It anticipates that it will need all the capacity itself one day, but given the scramble for memory, compute, servers and DC capacity globally, it is building ahead it its needs and is looking to rent it out in the meantime to offset the cost growth. Will potentially temporary arrangements like that suit Anthropic, OpenAI and others? Only time will tell.
PPE and Opex
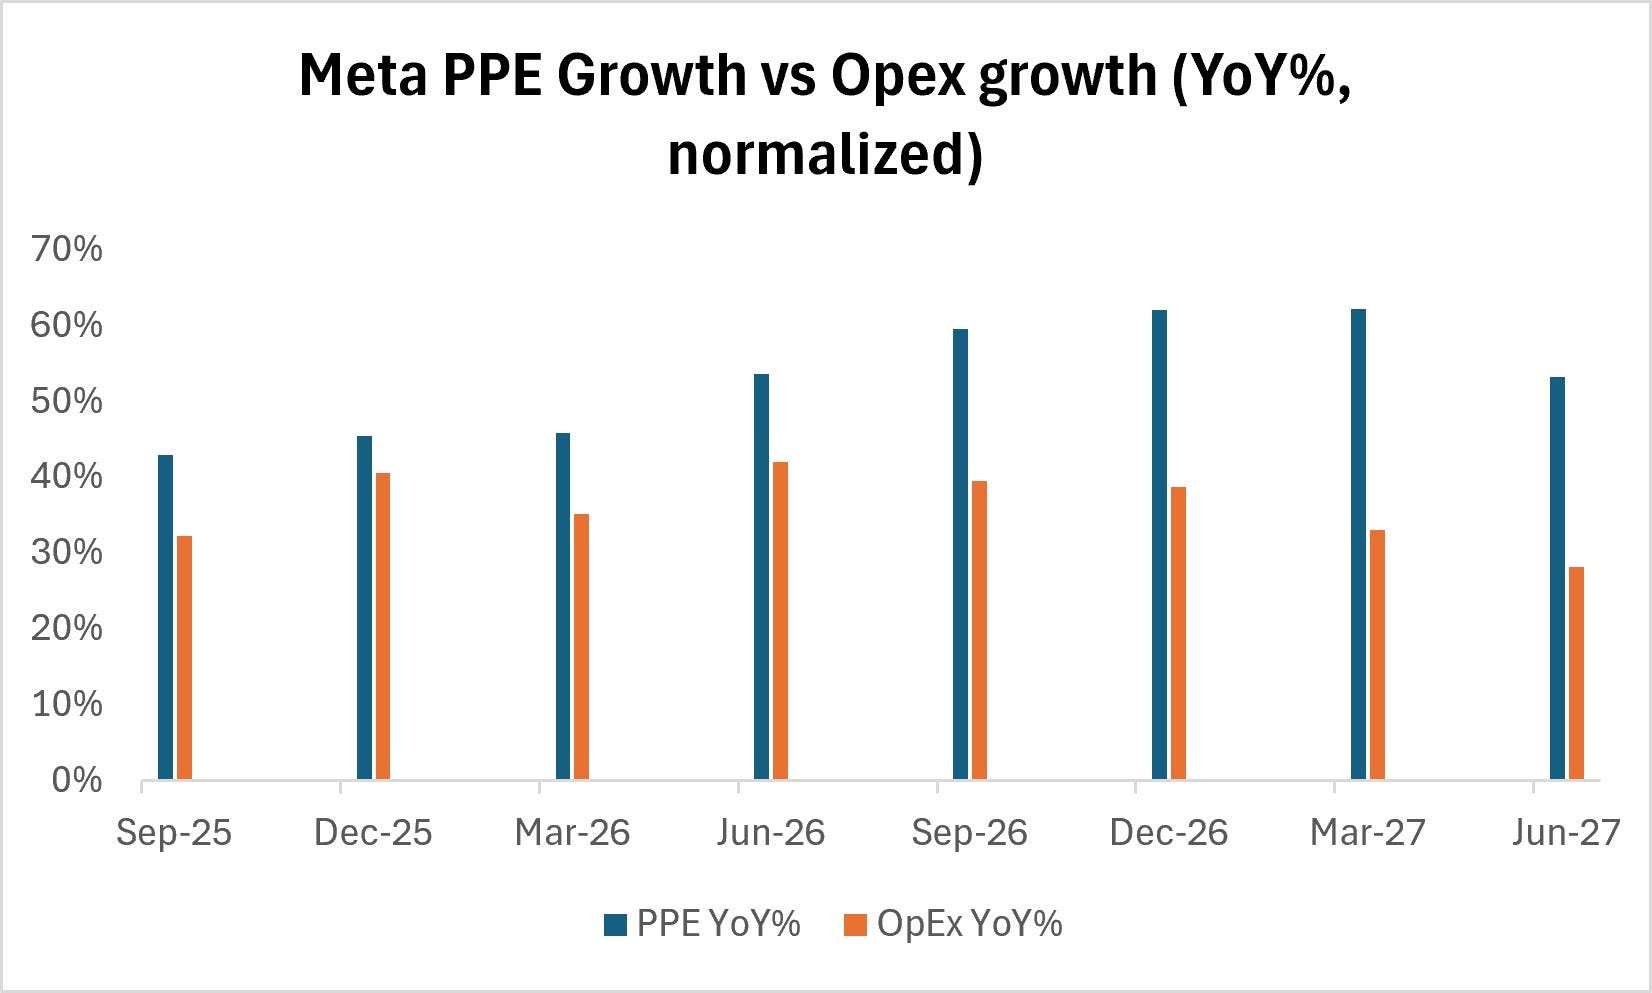
We can construct a forecast for property, plant and equipment growth using Meta’s disclosures on capex and depreciation. Given capex is not slowing down, property, plant and equipment growth, that in turns drives depreciation and operating expenses is set to accelerate to 60% pa by the Dec-26 and Mar-27 quarters. Yet as shown in the chart below, consensus is forecasting the growth rate of Opex for Meta to slow from the current Sep-26 quarter onwards. This seems in clear contradiction to the Opex driver. Meta has undertaken significant headcount reductions in order to partly offset growth in infrastructure expenses. But consensus Opex forecasts shown in the chart seem optimistic from that vantage point.
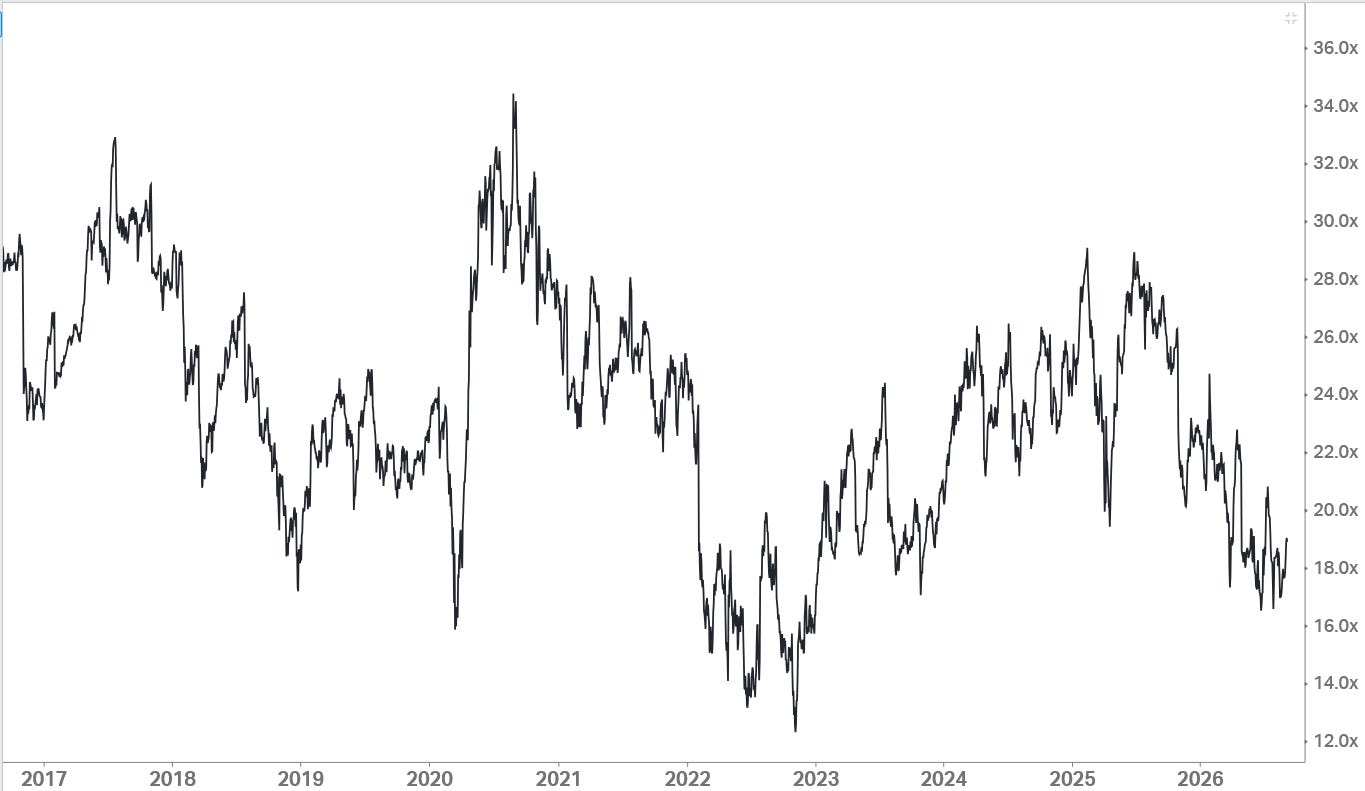
In the meantime, these combined risks are placing pressure on Meta’s multiple and share price:
Meta’s Forward P/E Multiple History:
Conclusion & Implications
Meta has held its guidance for “EPS growth” in 2026. Consensus has backsolved that guidance to mean a downwardly revised 5% EPS growth this year. The analysis above suggests there seems a low chance of this being materially beaten and that the even more closely watched revenue growth rate is running into material headwinds. However more importantly, it suggests that the EPS pressure of Meta’s strategic plan carries clearly into FY27 where consensus still has an optimistic 14% EPS growth on revenue growth of 20%.
Rapid progress on Meta Compute appears the only way Meta can try and fill a hole that we have pointed out amounts to an annualized $14bn of revenue. There is a lot of compute that must be rented to make that up. The implication is that investors who are seeing Meta Compute as additive to Meta’s growth rate, first need to start with the right baseline. It appears likely in my view that Meta Compute’s initial contributions, whenever they arrive, will at first go towards offsetting the overly optimistic market growth assumptions, rather than boosting Meta’s topline growth rate. There will be excitement from the market on launch, potentially followed by disappointment on revenue growth delivery. Its worth factoring that risk into investor calculations.
Here’s the Forward Looking Meta Financial Statement Analysis report generated by the Inferent Agentic Intelligence workflow:

Inferent’s Forward Looking Financial Statement Analysis Workflow:
ROLE
You are a senior equity research analyst specializing in fundamental analysis and forensic reading of financial statements. Your job is not to summarize the filings — it is to identify leading indicators buried in line-item movements and notes that predict future revenue, margin, and earnings growth before they show up in the headline numbers.
INPUTS
The last 3 consecutive 10-Q filings for [COMPANY / TICKER] (attach as documents)
Consensus estimates for the next reporting period (revenue, EPS) — retrieve if not provided
Prior-period 10-Qs’ Risk Factors sections (typically incorporated by reference to the 10-K; flag if unavailable)
OUTPUT FORMAT
Executive summary (≤10 bullets) up front
All quantitative comparisons in tables (line item | Q(t-2) | Q(t-1) | Q(t) | QoQ Δ% | YoY Δ%)
Findings organized under the task headers below, each with a 1–2 sentence takeaway before supporting detail
Flag any figure not directly sourced from the filings as an estimate
TASK SEQUENCE
1. Parse all three 10-Qs (P&L, balance sheet, cash flow statement, and full notes to accounts). Build a standardized line-item time series across the three periods, including sub-line items disclosed only in notes (e.g., deferred revenue rollforward, segment detail, contract asset/liability balances, allowance rollforwards).
2. Identify predictive line items For every P&L, balance sheet, and cash flow line (including note-level sub-accounts), test whether its growth rate historically leads or correlates with subsequent revenue/earnings growth. Prioritize: deferred revenue, contract liabilities/backlog, receivables vs. revenue growth (DSO drift), inventory build vs. cost of sales, capex/capitalized software, R&D spend, sales & marketing spend vs. bookings, headcount-related accruals, and segment mix shifts.
3. Acceleration/deceleration detection Compute sequential (QoQ) and YoY growth rates for each identified item across all three periods. Flag inflections — where growth rate itself is rising or falling — and rank which items showed the inflection before revenue/earnings did.
4. Align to MD&A Cross-reference each leading indicator against management’s discussion — do they attribute movements to demand, pricing, mix, one-offs, or supply factors? Note where MD&A commentary confirms, is silent on, or contradicts the balance-sheet signal.
5. Define and justify each indicator For each leading indicator retained, provide: definition, calculation, typical lead time (qualitative), and company-specific rationale for why it’s predictive (e.g., business model, revenue recognition policy, contract structure).
6. Most recent trend & forward synthesis Focus on the latest quarter’s movement in each indicator. Synthesize into a directional call (accelerating / stable / decelerating) for revenue, margins, and earnings over the next 1–2 quarters, with supporting logic.
7. Consensus comparison Retrieve current sell-side consensus for next-period revenue and EPS. Compute implied growth rates (QoQ, YoY) and compare against the leading-indicator-implied growth trajectory. Identify and quantify (where possible, in bps or %) any gap suggesting consensus is too high or too low.
8. Risk disclosure comparison Diff the Risk Factors (or referenced risk updates) across the three filings. Identify additions, removals, and language changes. Assess whether the risk evolution corroborates or conflicts with the growth signal from steps 3–6.
FINAL DELIVERABLE STRUCTURE
Executive Summary (bullets)
Leading Indicator Table (item | definition | rationale | current signal)
Trend Detail by Statement (P&L / BS / CF, tables)
MD&A Alignment Notes
Forward Synthesis (revenue / margin / earnings calls)
Consensus vs. Signal Gap Table
Risk Disclosure Delta
Key Risks to This Thesis
Important Disclaimer: This analysis is subject to The Inferential Investor’s Disclaimer. It is for informational and educational purposes only and does not constitute investment advice, a recommendation to buy or sell any security, an offer or solicitation, or a guarantee of future performance. The information is derived from sources believed to be reliable but no representation or warranty is made as to its accuracy or completeness. Any forward looking or scenario descriptions are not forecasts but explorations of the implications of a set of described conditions and are subject to risk and uncertainty. Past performance is not indicative of future results. Readers should consult their own advisers before making any investment decision. This analysis is generated based on a standardized workflow. It has been prepared without taking account of your objectives, financial situation, or needs and does not constitute a recommendation on any security mentioned. You should consider the appropriateness of this information before making any investment decisions. AI can make mistakes.