

Global Data Center Infrastructure: Supply-Demand Dynamics & Over-Capacity Risk Assessment
Investigating the sell off in Artificial Intelligence stocks and the implications
The following report was AI assisted with the Thematic and Industry Supply Chain Analysis prompt from the professional prompt library on The INFERENTIAL INVESTOR.
Subscribe to access these tools.
Important Disclaimer: The following stock discussion and analysis is subject to The Inferential Investor’s Disclaimer. It is indicative, designed to be educational and instructive on advanced techniques for AI in investment research and is not in any respect financial advice or an investment recommendation.
Introduction
Bloomberg has just published a fascinating article on the global data center build-out that puts some tangibility into the concern around industry over-capacity developing over time. You can access the article with a subscription here:
What’s apparent from the article are a number of takeaways:
The AI demand ramp is attracting more and more speculative, inexperienced operators, securing power allotments and attempting to translate those into financing and anchor leases to get their project out of the ground.
There is no consensus on what the future demand profile for compute and GW capacity actually looks like. Build plans can be mapped, but what kind of market will they be launching into?
It is clear these concerns are coloring the listed AI infrastructure stocks. Michael Burry has been the poster child of the AI bubble view but as far as I’ve seen has mainly been concerned with the financial returns on AI investments (“the Revenue Gap”) as opposed to other trends that present a challenge to the “build it and they will come” narrative. From the highs this year, Coreweave is now down 55%, Equinix and Digital Realty Trust are down 20%, Next DC is down 30%, American Tower is down 35%, Iron Mountain is down 30% and the list goes on. The trend extends across traditional DC stocks and Diversified REITs developing new AI-optimized DC assets. This sell off represents fairly material market concerns on how this will play out.
I employed our research workflows to examine the aspects of data center demand and supply that aren’t answered by that article. Specifically, how might the requirements of customers change over the outlook period (to 2035), what risk do technological developments present to projects being planned now and how do we define the likely scenarios of how the balance of supply and demand play out with their associated probabilities.
The conclusion of this AI research was a bit of a surprise to me. Perhaps it shouldn’t have been, but AI itself aligns its views mostly with the IEA’s “high efficiency” scenario where technological developments, specifically with respect to power usage per token and chip efficiency, are the defining risk to the data center supply picture. This, along with the transition of requirements from remote training factories to more locally located inference facilities with different cooling needs, results in many stranded assets over time. The research highlights a surprisingly uncertain outlook for these stocks. Even stocks like Goodman Group, who are developing tier 1, locally located DC assets and have the relationships and expertise to attract the well funded hyper-scalers, may be caught up in a valuation air pocket driven by investor uncertainty as these changes occur.
Many readers may not be aware of the technological risk posed by new methods being developed of training and running new AI models. But they are most starkly exposed by the per token API pricing comparison between Deepseek and the top US models (ChatGPT and Gemini) shown in the table below:
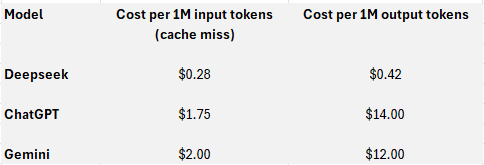
The US models are on average 7x more expensive on inputs and 30x on outputs than Deepseek. While most corporates will not trust their data to Deepseek, this cost difference already means that Deepseek is the default choice for many AI start-ups seeking to provide simple consumer solutions. The token cost of running these software solutions on the US models is too prohibitive.
What this shows is how dramatically different AI revenues, power requirements and compute needs can be under alternative technological models. There is no doubt that the US models are superior to Deepseek (I have tested and confirmed this for investment research requirements), however this comparison stands as a signpost for the degree of risk there is as new methods and technologies arrive for inference and model architecture.
This report is long, but highlights critical aspects of the AI supply and demand picture that need to be considered by investors in 2026.
Executive Summary
The global digital infrastructure landscape is currently navigating a period of capital deployment and capacity expansion that has no historical precedent in the technology sector. Driven by the generative artificial intelligence (AI) “arms race” and the requisite transition from general-purpose central processing units (CPUs) to accelerated computing architectures (GPUs/TPUs), the data center industry is projecting capital expenditures (CapEx) exceeding $1.7 trillion by 2030.1 This report provides an exhaustive analysis of the total capacity of data centers planned globally, contrasting this pipeline against the theoretical capacity required to serve the mature AI and cloud industries through the 2030–2035 horizon.
Our analysis indicates a bifurcation in the market trajectory. The near-term period (2025–2029) is characterized by a “Supply Crisis,” where demand is constrained strictly by physical limitations—power availability, transmission infrastructure, and component supply chains. During this phase, vacancy rates in primary markets will remain near historic lows (sub-1% in Northern Virginia) 2, and pricing power will reside firmly with operators.
However, as we look toward the 2030–2035 horizon, the risk profile shifts significantly. A convergence of factors suggests a rising potential for an “Economic Over-Capacity” scenario—distinct from a physical glut—where the cost of infrastructure recovery cannot be met by AI monetization revenue. This “Infrastructure-Revenue Gap,” currently estimated at over $600 billion annualized 3, threatens to strand assets that are not optimized for the specific workload requirements of the mature AI economy.
Crucially, forecasts for power demand are exhibiting extreme variance. While Goldman Sachs projects a 165-175% surge in data center power demand by 2030 4, the International Energy Agency (IEA) introduces a “High Efficiency” scenario where demand plateaus at roughly 700–800 TWh by 2035, despite exponential growth in compute output.6 This decoupling of compute demand (FLOPs) from energy demand (Gigawatts), driven by algorithmic breakthroughs like DeepSeek 7 and hardware innovations adhering to Koomey’s Law 8, represents the single largest deflationary risk to the prevailing “unlimited growth” narrative.
This report maps these dynamics across key global regions—from the saturated hubs of Northern Virginia and Frankfurt to emerging gigawatt-scale markets in Johor, Malaysia, and the Middle East—and provides a nuanced risk assessment of the industry’s trajectory into the next decade.
1. Strategic Context: The AI Industrial Revolution
The transition from the cloud computing era (2010–2023) to the AI era (2024–Present) marks a fundamental shift in the nature of digital infrastructure. Where the cloud era was defined by the migration of enterprise IT workloads to centralized hyperscale facilities, the AI era is defined by the industrial-scale manufacturing of intelligence. This shift has profound implications for facility design, location strategy, and capital requirements.
1.1 The Shift from Linear to Exponential Demand
Historically, data center demand grew in correlation with internet penetration and digital transformation—a linear largely predictable trajectory. The integration of Generative AI introduces an exponential variable. Training a frontier model requires vast, contiguous clusters of compute, operating at power densities (100kW+ per rack) that legacy facilities cannot support.10 Furthermore, the computational intensity of these models is scaling at approximately 4x per year, significantly outpacing Moore’s Law.11
This exponential demand curve is driving a “Gigawatt Scale” mentality. Hyperscalers are no longer seeking 20-50 MW leases; they are commissioning multi-gigawatt campuses. The “Stargate” project proposed by Microsoft and OpenAI, with a potential 5 GW capacity and a $100 billion price tag 12, exemplifies this new unit of analysis. For context, a 5 GW load is equivalent to the power consumption of approximately 5 million U.S. homes or five standard nuclear reactors.10
1.2 The Sovereign AI Imperative
Compounding commercial demand is the rise of “Sovereign AI.” Governments view domestic AI infrastructure as a matter of national security, analogous to energy independence or defense capability. This has led to state-sponsored mandates for domestic compute capacity in nations ranging from France and Japan to Saudi Arabia and the UAE.14 This trend creates a “demand floor” that is relatively price-inelastic; sovereign entities will procure capacity to secure strategic autonomy even if commercial Return on Investment (ROI) metrics would not justify the expenditure.
2. Global Demand Dynamics (2030–2035)
To assess over-capacity risk, we must first quantify the projected demand. Forecasts for the 2030–2035 period vary significantly based on assumptions regarding AI adoption rates and efficiency gains.
2.1 Aggregate Power Demand Forecasts
Financial institutions and energy agencies have revised their long-term forecasts upward, projecting that data centers will consume a significant share of global electricity.
Table 1: Global Data Center Electricity Demand Forecast Scenarios (2030–2035)
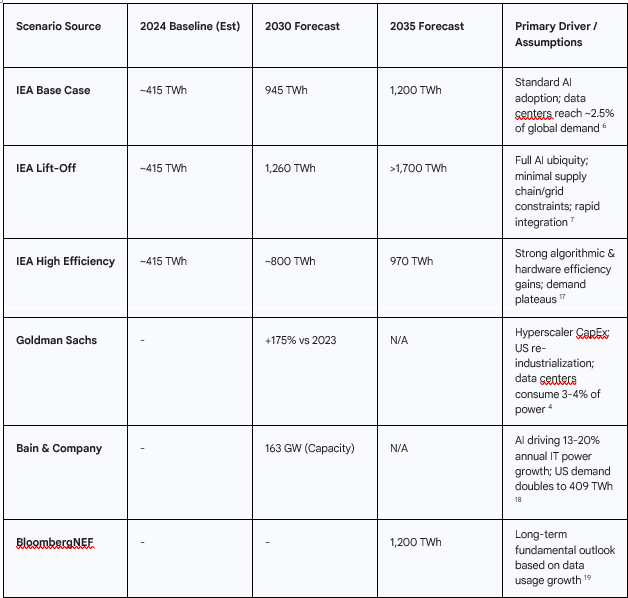
The consensus suggests a tripling of capacity by 2035 in the base case. However, the divergence between the “Lift-Off” (1,700 TWh) and “High Efficiency” (970 TWh) scenarios in 2035 is nearly equal to the total global data center consumption of today. This 730 TWh delta represents the “uncertainty zone”—the margin of error where over-capacity risks reside.
2.2 The Structural Shift: Training vs. Inference
A critical determinant of future infrastructure utility is the workload split between AI Training and AI Inference.
● The Training Era (2023–2028): Currently, the market is dominated by the need to train foundation models. This workload requires massive, centralized compute clusters. Latency is irrelevant; a model can be trained in North Dakota or desert regions of the Middle East as long as power is cheap and abundant. This drives the development of remote “Mega Campuses”.20
● The Inference Era (2029–2035): As models mature, the dominant workload shifts to inference—the application of these models by end-users. Bain forecasts that AI will represent nearly half of all compute workloads by 2030, driven primarily by inference.14 Inference is latency-sensitive. An AI agent driving a car, managing a factory, or conducting a real-time voice conversation requires compute infrastructure located close to the user (the “Edge”).20
Implication for Over-Capacity: There is a significant risk that the industry is over-indexing on remote, centralized “Training” factories. By the time these gigawatt-scale campuses come online in the early 2030s, the market demand may have shifted toward distributed, urban-proximate “Inference” facilities. A 5 GW campus in a remote region may face utilization challenges if it cannot serve the latency requirements of the 2035 inference economy.20
2.3 The “Jevons Paradox” of Compute
While efficiency gains (discussed in Section 7) typically reduce unit consumption, Jevons Paradox suggests that as compute becomes cheaper and more efficient, total consumption will increase as new use cases become viable.
● Elastic Demand: If the cost of inference drops by 90% (due to efficient chips and models), applications that are currently economically unviable—such as constant, real-time video analysis or personalized AI tutors for every student—become feasible.
● The Plateau Risk: However, the “High Efficiency” scenarios from the IEA 6 suggest a limit to this elasticity. If algorithmic efficiency moves faster than new application development, total power demand could plateau, leaving over-built power infrastructure underutilized.
3. The Supply Response: Building the Gigawatt Scale
The supply side of the equation is responding with a construction boom of unparalleled magnitude. Capital is flooding into the sector to secure the three critical ingredients of AI infrastructure: Power, Land, and Chips.
3.1 The Rise of the Mega-Campus
The fundamental unit of data center capacity is evolving. In the cloud era, a 30-50 MW campus was considered large. In the AI era, hyperscalers are planning campuses that exceed 1 GW.
● Microsoft & OpenAI (Stargate): The “Stargate” project outlines a roadmap for a supercomputer campus in the US with a power requirement of up to 5 GW, targeting a launch in 2028-2030. This single project represents a capital commitment of up to $100 billion.13
● Oracle & Vantage: Oracle is partnering with developers to secure multi-gigawatt pipelines, referencing sites with 1 GW+ potential to support training clusters.12
● Meta & Google: Meta continues to scale its custom-built fleet, recently announcing a $10 billion facility in Louisiana.21 Google is similarly expanding its footprint with “Mega Energy Parks”.21
These projects function less like commercial real estate and more like heavy industrial utilities. They often require dedicated substations, onsite backup generation, and direct integration with high-voltage transmission lines.
3.2 Capital Expenditures Forecast
McKinsey estimates that global capital expenditures on data center infrastructure (excluding the IT hardware itself) will exceed $1.7 trillion by 2030.1 When including the cost of GPU/TPU hardware, network fabric, and energy infrastructure, estimates for the total ecosystem investment rise to between $3 trillion and $4 trillion.22 This massive capital injection creates a high barrier to entry but also raises the stakes for asset utilization. If these assets are not fully monetized, the financial fallout would be systemic.
4. Regional Market Analysis: The Geography of Compute
The physical constraints of power grids are forcing a redrawing of the global data center map. The traditional “FLAP-D” (Europe) and Northern Virginia (US) hubs are saturated, pushing development into new, power-rich—or at least power-accessible—markets.
4.1 North America: Saturation and Spillover
● Northern Virginia (NoVA): As the world’s largest data center market, NoVA is effectively capped. Vacancy rates are below 1%.2 The PJM interconnection queue is gridlocked, with reforms delaying new large load connections. Pre-leasing activity now extends into 2027 and beyond, meaning practically no new capacity is available for immediate requirements.2
● Phoenix, Arizona: Phoenix has emerged as the second-largest market in North America. However, it faces a looming existential threat: water scarcity. Data centers in Phoenix are projected to consume 14.5 billion gallons of water annually by 2030—enough to supply the city of Scottsdale for two years.23 This creates regulatory risk; future moratoriums on evaporative cooling could strand assets or force expensive retrofits to air-cooled or closed-loop liquid systems.
● Texas (ERCOT): Texas has become the destination of choice for large loads due to its deregulated grid. The ERCOT large load queue has quadrupled in a single year to 226 GW 24, with 77% of requests coming from data centers. While not all of this will be built (”phantom load”), the scale indicates a massive planned capacity influx. Texas’s challenge is transmission—moving wind power from the West to the load centers in Dallas/Fort Worth.25
● Emerging Hubs: Constraint spillover is benefiting markets like Atlanta, Columbus (Ohio), and the Pacific Northwest.
4.2 Europe: The Grid Crisis
● FLAP-D Constraints: The primary markets (Frankfurt, London, Amsterdam, Paris, Dublin) are severely grid-constrained. In some FLAP-D zones, the wait time for a new grid connection is 7–10 years.26
● The “Peripheral” Shift: This congestion is driving a bifurcation. Latency-sensitive workloads remain in FLAP-D, while training workloads migrate to the Nordics (abundant hydro/wind) and Southern Europe (Spain, Italy, Milan). Goldman Sachs estimates the European pipeline could reach 100 GW by 2035, with significant growth in these peripheral markets.27 Milan, in particular, has joined the “major league” of EU markets.28
4.3 Asia-Pacific: The Johor Phenomenon
● Johor, Malaysia: Perhaps the fastest-growing market globally, Johor has emerged as the spillover hub for Singapore (which has had a moratorium on new builds). Major hyperscalers (Microsoft, Google, AWS) and Asian giants (ByteDance) are building gigawatt-scale campuses there.29 Capacity in Southeast Asia is projected to triple by 2030.30 The risk here is “over-exuberance”—speculative building is rampant, raising concerns about potential oversupply if the “Singapore spillover” demand softens or if Singapore relaxes its own restrictions.31
● Domestic Giants (India & Japan): India and Japan are driving growth through domestic digitization and data sovereignty laws. Japan’s capacity is forecast to grow at a double-digit CAGR, driven by both commercial and government demand.32
4.4 The Middle East: Capital vs. Climate
● The Energy Advantage: The Middle East, particularly Saudi Arabia and the UAE, offers cheap energy and massive capital availability through Sovereign Wealth Funds (PIF, Mubadala). Projects like the Transcendence AI Initiative ($100 billion) aim to position the region as a global AI hub.33
● The Climate Penalty: The region faces a physics challenge: cooling data centers in 50°C heat is energy-intensive. This results in a higher PUE (Power Usage Effectiveness), making the “useful work” per watt lower than in the Nordics. However, the region is betting on liquid cooling technologies and solar abundance to offset this. The UAE’s “Stargate” partnership suggests they are positioning for the high-end training market.15
5. Constraints & Bottlenecks: The Supply Governors
The primary argument against an over-capacity crisis in the 2030s is the sheer difficulty of building infrastructure. Constraints act as a natural governor, preventing supply from outpacing demand too rapidly.
5.1 The “Speed-to-Power” Bottleneck
Power availability has replaced location as the primary site selection criterion.
● Interconnection Delays: In the US, PJM and MISO queues are backlogged. The FERC reform process is slow. In Europe, grid upgrades are a decade-long process.
● Transmission Reality: Even if generation exists (e.g., a solar farm), the high-voltage transmission lines needed to connect it to a data center take 7–10 years to permit and build in Western democracies.34 This physical reality dictates that the “theoretical” pipeline will be smoothed out over a longer timeline than developers anticipate.
5.2 Supply Chain Fragility
● Transformers: The lead time for high-voltage transformers remains elevated (3–4 years). Manufacturers like Siemens Energy are prioritizing orders, but the global capacity to produce this heavy electrical equipment is a hard constraint.35
● Labor Shortages: There is a critical shortage of skilled labor—electricians, HVAC technicians, and mission-critical facility engineers. This is delaying project completions in markets like Phoenix and Northern Virginia.12
6. Technological Disruption & Efficiency: The Deflationary Risks
While most analysis focuses on growth, the most significant risk to the data center investment thesis is efficiency. Radical improvements in how AI is computed could decouple economic value from physical infrastructure needs.
6.1 Algorithmic Efficiency: The “DeepSeek” Effect
Recent developments in model architecture, such as DeepSeek-V3, have demonstrated that frontier-level intelligence can be trained and run at a fraction of the compute cost previously assumed.5
● The Mechanism: By optimizing code and using sparse architectures (Mixture of Experts), developers can achieve GPT-4 level performance with significantly fewer FLOPs.
● The Impact: If the amount of compute required to generate a “unit of intelligence” drops by 50% every year, the demand for new physical data centers grows slower than the demand for AI services. This is a deflationary pressure on infrastructure demand. The IEA “High Efficiency” case models this, showing a potential plateau in energy demand.6
6.2 Hardware Efficiency: Koomey’s Law & Photonics
● Koomey’s Law: The observation that the energy efficiency of computing doubles roughly every 1.5 years. Nvidia’s roadmap (Blackwell, Rubin, Ultra) continues to push this envelope.36
● Optical Computing (Photonics): Research indicates that integrated photonics (using light instead of electrons for data transfer) could reduce data center energy consumption by 50% by 2035.37 If this technology matures by 2030, it would drastically increase the capacity of existing power envelopes, reducing the need for greenfield construction.
7. Economic Viability Analysis: The Risk of Over-Capacity
We now address the core objective: assessing the risk of over-capacity in the 2030s.
7.1 The $600 Billion Revenue Gap
Sequoia Capital’s analysis identifies a “Revenue Gap.” The AI industry is spending hundreds of billions on GPUs and data centers ($1T+ CapEx), implying that they need to generate ~$600 billion in annualized revenue to just break even.3 Currently, actual generative AI revenue is a fraction of this.
● The Risk: If “killer apps” do not emerge to close this gap by ~2028, the hyperscalers (AWS, Google, Microsoft, Meta) may face shareholder pressure to drastically cut CapEx. This would lead to an “Air Pocket” in demand—a sudden halt in new leases—leaving developers with half-built campuses and no tenants.
7.2 Asset Stranding: The “Legacy” Problem
The risk of over-capacity is not evenly distributed.
● High Risk: Legacy data centers (built pre-2023) that are air-cooled, have low ceiling heights, and lack the floor loading capacity for heavy AI racks. These facilities cannot support the >100kW densities of 2030-era hardware. They face obsolescence.
● Low Risk: Modern, liquid-cooling-ready, high-density AI factories. Even in a downturn, workloads will migrate to these more efficient facilities to save on OpEx (power costs).
7.3 The “Phantom Load” Queue
The 226 GW queue in ERCOT 24 and similar queues elsewhere contain significant “phantom load”—speculative requests from developers who do not have a tenant or financing. As grid operators implement stricter deposits and readiness checks (e.g., PJM’s reforms), much of this “planned” capacity will evaporate. This suggests that the supply glut feared from these massive numbers is overstated; the actual buildable supply will be much lower.
8. Scenario Planning: 2030–2035 Outlook
We project three potential scenarios for the 2030–2035 timeframe.
Scenario A: The “Linear Boom” (Probability: 30%)
● Description: AI demand continues to scale exponentially. Jevons Paradox holds (efficiency drives usage). Constraints (power/grid) are slowly resolved.
● Outcome: Supply struggles to keep up with demand through 2035. Vacancy remains low. Power prices soar. Sovereign AI mandates ensure no over-capacity.
● Winner: Energy producers and “Speed-to-Power” developers.
Scenario B: The “Efficiency Shock” (Probability: 40%)
● Description: Algorithmic advances (DeepSeek-style) and hardware efficiency (Photonics/Nvidia) drastically reduce the power-per-token. The IEA “High Efficiency” case is realized.6
● Outcome: Physical power demand plateaus or grows slowly. The massive pipeline of 2025–2028 projects comes online into a market that doesn’t need more gigawatts, just better chips.
● Risk: Significant over-capacity in “shell” infrastructure. Asset stranding for facilities with high PUE.
● Winner: Chip designers and legacy grid operators (relief from load).
Scenario C: The “CapEx Crash” (Probability: 30%)
● Description: The “Revenue Gap” is never closed. AI proves to be a sustaining innovation, not a disruptive one. Hyperscalers pull back spending in 2028.
● Outcome: A severe glut of capacity in 2030. Rents collapse. Private equity backed developers face insolvency.
● Risk: Financial crisis in the digital infrastructure REIT sector.
Conclusion: Navigating the 2030s
The global data center industry is currently building for a “Scenario A” world while technological trends point toward “Scenario B.”
Is there a risk of industry over-capacity in the 2030s?
Yes. However, it is likely to be an Economic Over-Capacity rather than a physical one.
The risk is not that we will have too many data centers, but that we will have the wrong kind of data centers in the wrong places.
1. Workload Mismatch: We are building massive “Training” campuses in remote locations (Scenario A), but by 2030, the market may shift to distributed “Inference” (Scenario B).
2. Efficiency Mismatch: We are prioritizing raw power access over efficiency. If 2035 technology allows for 10x compute in the same power envelope, the desperate scramble for gigawatts today may look like an over-correction in hindsight.
Final Assessment: The 2025–2029 period represents a “Supercycle” of construction defined by shortage. The 2030–2035 period will be a “Rationalization” phase. Investors and developers must guard against the assumption that power demand will scale linearly with compute demand forever. The decoupling of these two metrics via efficiency is the single greatest strategic risk to the long-term infrastructure thesis.
Recommendations for Stakeholders:
● Prioritize Flexibility: Design facilities that can pivot from Training (liquid-cooled, dense) to Inference (air/hybrid, diverse connectivity).
● Scrutinize Location: Avoid markets solely dependent on “spillover” demand (e.g., secondary markets with no local industry). Stick to regions with intrinsic economic demand or sovereign backing.
● Monitor the Revenue Gap: The health of the AI software market is the leading indicator for infrastructure health. If software margins don’t improve by 2027, the infrastructure build-out will face a violent correction.
Thank you for this very comprehensive outlook.