

Why are Gold and Silver collapsing now? Rational Bubble theory and the catalysts today
By accessing and reading this article, readers acknowledge and agree to be bound by the terms of our full legal disclaimer. The information provided herein is for educational and general informational purposes only and does not constitute professional financial or investment advice nor a recommendation to trade in any stock mentioned.
For those wondering “why now?” about the historic collapse in Silver on Friday (largest single day down move on record according to Bloomberg) and associated sell off in gold, I posted the following on X back in October ‘25. It is highly relevant to explain price action in bubbles - both on the way up and the subsequent collapse and most investors are unaware of this particular theory…
At the time I wrote it in relation to AI stocks as a question and theory in one, but the theory is relevant to the events today in gold and silver as well. It particularly helps understand in relation to the events of Friday 30th Jan why such seemingly innocuous headlines can trigger such a large collapse in prices.
Following the explanation of the “rational bubble theory”, I link it to today’s context and the triggering catalysts:
————————————————
Everyone debates “Are AI stocks a bubble or not?”
What if they’re a Rational Bubble.
This is an actual mathematical concept. Market prices can be the sum of the Expected (Intrinsic) price plus a Bubble component:
Unlike pure finance theory, this branch allows for prices to deviate from fair value with a medium term correcting mechanism.
The Bubble component, B, has two scenario probabilities at any moment.
(1) Prices can move higher, with Probability x.
(2) Prices can collapse with probability (1-x).
Assume for the moment the intrinsic component E(P), is fixed over a short horizon. As the bubble component B expands, the probability of a collapse gradually rises (1-x) and x (the probability of a further increase) shrinks. Consequently, the investor rationally requires a greater, faster return from scenario 1 (continued expansion), in order to compensate for the expanding probability of scenario 2 (collapse). The more x < (1-x), the larger B becomes and, perversely but rationally, the faster it expands.
This means it can be RATIONAL for prices to follow the exponential curve (see chart).
The more “B” expands, the more return the investor requires in a shorter timeframe to compensate for the expanding “(1-x)” probability. But the field of maths shows us there’s a limit.
At the extreme, when (x) has shrunk to a small value, and the rate of expansion of “B” has driven prices near vertical, investors naturally perceive a very high risk of a collapse (1-x) and virtually no incremental value of “B” can compensate them anymore - they abandon ship.
Not only that, but whats more important than the actual value of B is E(B) - the expected value of B. The market projects B. Investors read the implicit probabilities and act on what B may become (FOMO and JOMO behaviors are really about “B” not E(P))
In this mathematical theory, Scenario 2 eventually arrives, usually with a catalyst that often seems small relative to the magnitude of the moves, but at a point that is the singularity, and the bubble term “B” collapses chaotically to zero (and possibly negative for a period, given market liquidity, leverage and forced selling).
This then explains why the classic shape of a bubble chart is the exponential increase followed by a cliff. Can we see that in markets today?
Why do we sometimes see volatile, choppy price action just before the collapse?
As the probability of further expansion, (x), becomes small and the term B becomes large (in absolute terms and equal to or larger than E(P) itself), the significance of small events become very large (which is why small catalysts can drive outsized moves).
Mathematically, if x=10% and (1-x) is 90%, then to have a value of B just equal to E(P), means the expected value of B from more of scenario 1 (even more expansion) must be huge and highly improbable to all, when (1-x) is 90%. Any change in “x” drives a material change in E(P)+B, both positively and negatively - meaning prices CHOP HARD!
Updated note: we have seen this increasingly through January 2026 - large sell offs particularly in tech stocks followed by recovery, rinse and repeat, even as prices still moved higher overall.
But eventually, either upwards price action itself (collapse under own weight as x goes to zero), OR events that affect confidence in the “x” probability (essentially volatility and news) OR a combination, act to force the singularity and B collapses to ZERO.
That is - rises in prices essentially can cause their own collapse mathematically even with small catalysts.
———————————————————
Todays context:
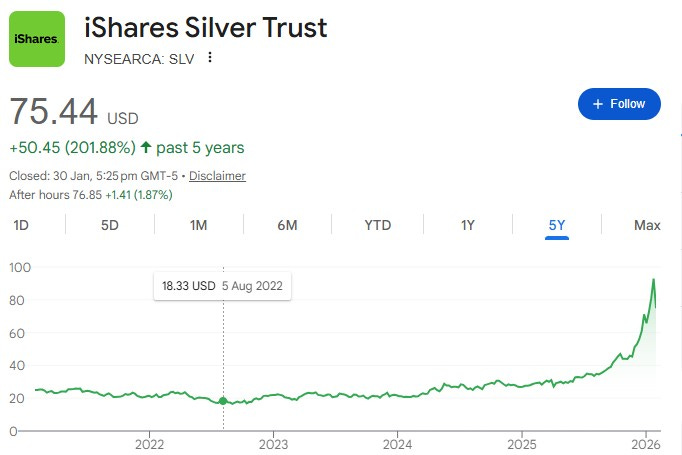
The rally in silver and gold has been feeding on the USD debasement narrative for some time and has attracted ever increasing crowdedness and leverage behind the trade. As is often the case, a core financial asset or class rallies first (gold) and then investors move out the risk curve to less liquid proxies that experience even greater moves (silver).
Silver in particular has attracted the retail horde since late 2025. Recent events by the US administration to wield US leverage against various countries, particularly crescendo-ing in January 2026 with tariff threats against Europe, Greenland, Venezuela etc all fed the latest moves in the trade that were quite extreme.
However as the price move goes vertical (as the theory suggests), simple catalysts like the announcement of a new Fed chair / regime can catalyze investors to start taking profits as they affect the probability “x” which has large value implications for the bloated bubble term “B”.
Kevin Warsh is seen by some as less likely to be dovish than other favoured (feared?) candidates due to his previously reported hawkish comments during the GFC. He also favors a small Fed balance sheet and reduces some fears about Fed independence which both counteract the most recent debasement narrative.
The bipartisan deal to fund the US government and avert a shutdown also likely contributed to profit taking in precious metals - another case of a risk that was feared but expected given the constant noise on the US budget funding that investors have come to expect. Together these events are the classic bubble collapse catalyst expected by the theory - in themselves not that earth shaking, but given the extreme moves recently in gold and silver, as the theory suggests - that is all it can take.
I don’t pretend to know where prices will bottom or whether the volatility in precious metals expands across equities as investors sell what they can to fund margin calls in leveraged commodity positions. I do however, think that this theory is highly relevant to an understanding right now about what is happening / what could happen. It helps, particularly in the case of tech and AI stocks, when you see an exponential stock chart to consider:
What is the real intrinsic value (E(P)) that is justified by the growth in cashflows being seen; and
Which stocks may therefore be demonstrating the largest bubble component “B”.
The latter are quite obviously the ones to avoid / short in such a market scenario. If you find this explanation informative, feel free to share it around.
Andy West
31 Jan 2026.