What The Market May Be Getting Wrong About NVIDIA (and how to track it using AI)
plus setting up agentic data trackers to help identify disconnects between NVIDIA consensus and global data center capital expenditures
Preface: Did you know you can set up agentic data trackers in ChatGPT that automatically run in the background for a year and collect data for you, notifying you when new data points appear? I run a ChatGPT data center capex tracker across the companies mentioned in this report to collect and tabulate the data used here. It functions as my research assistant so I don’t have to set reminders to laboriously dig through earnings reports of tens of companies to get the data I need - saving hours of research time. The prompt to set this up is contained at the end of the article…
The debate about NVIDIA‘s medium term growth profile is critical for the stock price. Investors have sailed through the period of revenue and earnings acceleration as AI spend ramped following the launch of OpenAI’s ChatGPT in November 2022. Now, we’re clearly looking into the forward period where the law of large numbers and perhaps plateauing data center spend, see growth rates mean revert.
Data Center CapEx as the Primary Driver of NVIDIA
The NVIDIA story remains anchored to data center spend. In Q2 26, this segment represented 88% of the group’s revenues and is their highest margin division. In 2025, we have seen an acceleration in data center investment spend by the hyperscalers to unprecedented levels with the largest four (Microsoft, Amazon, Google/Alphabet and Meta) forecast to invest approximately $400bn in capital expenditures this year. Based on company comments in the most recent quarterlies, this is set to increase once more in 2026, however at a slower rate.
Implication: 2025 was the big year of positive surprise on DC capex growth. 2026 represents the first year of deceleration that investors will see in the AI infrastructure theme.
NVIDIA is a 2nd derivative play on data center capex. This is because their revenues grow when DC capex grows. Conversely, NVIDIA’s revenues will plateau when data center capex also plateaus. It doesn’t matter if this is at a high level of spend relative to history, if the tech industry simply reverts to rolling out new DC capacity at a constant (but historically elevated rate), investors will inevitably see NVIDIA’s revenue and earnings growth fall considerably from the recently elevated levels.
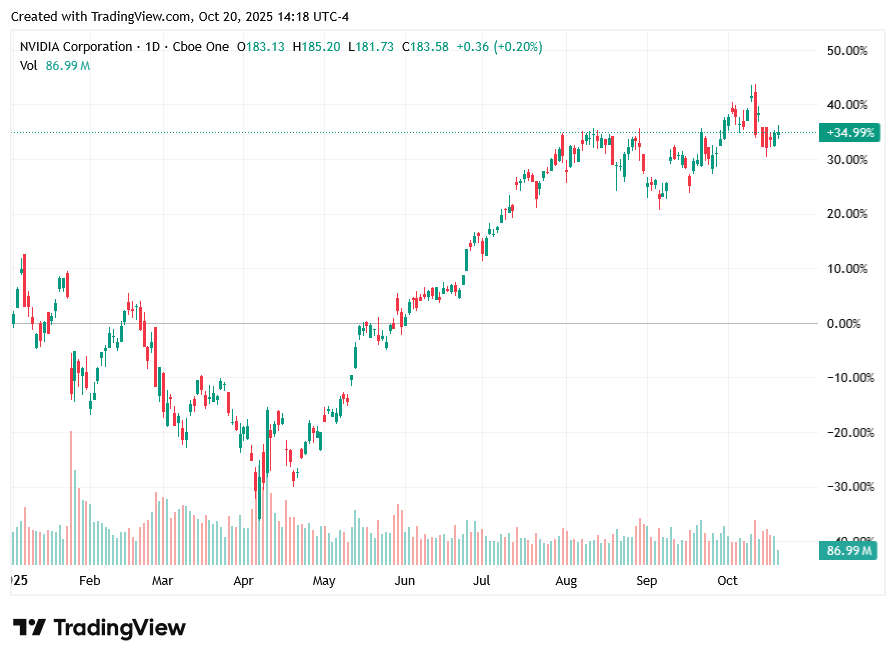
Despite this large acceleration in data center spend in 2025, its notable that NVIDIA’s stock price appreciation has slowed considerably likely reflecting these forward looking concerns. Export license controls to Chinese customers have had a small part to play in this, however the uplift in US data center spend could have carried NVIDIA through given their claimed backlog of demand. In 2024, NVIDIA’s stock price rose 180%, this has moderated to ~35% in 2025 YTD (a still attractive gain but a major deceleration nonetheless). The risk for investors lies in 2026 and what may prove to be erroneous assumptions by analysts regarding revenue and earnings (NVIDIA’s FY27 given a January year end).

NVIDIA’s Correlation to Global Data Center Capex
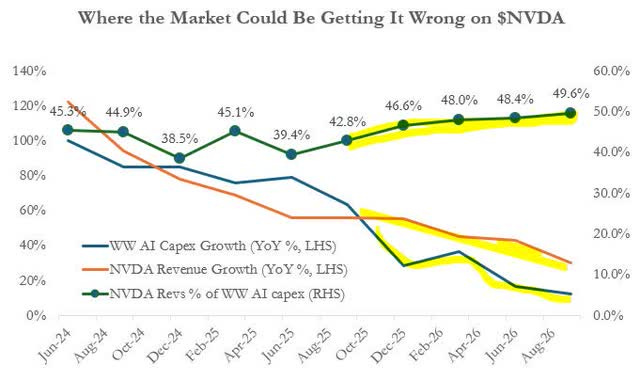
With NVIDIA’s revenue growth tied to data center capital expenditures it is instructive to examine the correlation between these metrics for clues to the future. To do this my AI data tracker gathers data on capital expenditures by 13 of the largest technology and AI publicly listed firms that I supplement with consensus forecasts. If we compare the total of the spend by these companies to Dell-Oro’s global estimates (a leading silicon valley DC infrastructure research firm), its capturing 67% of the estimated global spend. The chart below shows three series:
1. BLUE: Quarterly capex growth (YoY%, historic and consensus forecasts) for the largest 13 hyperscalers, AI and data center companies globally (Microsoft, Google, Amazon, Meta, Oracle, Coreweave, Apple, IBM, Bytebance, Tencent, Alibaba, Equinix, Digital Realty and Baidu). These companies represent the largest portion of global data centre spend outside of some Chinese state owned entities.
2. ORANGE: NVIDIA’s Quarterly Revenues (YoY% growth, actual and forecast).
3. GREEN: The ratio of NVIDIA’s revenues to our global data center capex proxy.

There are two striking aspects of this chart. The first, shown by the green series, is the near straight line relationship between NVIDIA’s revenues and our global data center capex proxy that has averaged 43% (RHS axis). This means that, with very little variation period to period, NVIDIA has achieved revenues equaling on average, 43% of the capex spent by these top 13 companies. The consistency of this relationship supports my primary contention that its the growth in global data center capex that drives growth in NVIDIA.
Where the Market May Have it Wrong
If we look at the growth rates of NVIDIA revenues vs the growth in Capex this relationship holds fairly well (shown in the blue and orange series) at least until we reach the forecast horizon from October 2025 onwards. This is where we see an unusual assumption set unfolding. Analysts collectively are assuming that NVIDIA’s share of global data center capex rises rapidly across 2026 from around 43% to nearly 50% by the end of the year.
This seems unlikely:
1. It is more likely that NVIDIA simply holds its already elevated market share or it slowly retraces as companies like AMD, Chinese competitors and internal chip development programs of NVIDIA’s largest customers start to gain some share. OpenAI’s recent $100bn deal with AMD and the need for native AI companies to lower scaling costs to move towards profitability heavily supports this view.
2. It assumes, on the basis of these capex numbers, that NVIDIA grows faster than data center capex spend over this period, shown in the orange line shifting above the blue line on the chart - a different scenario from recent history.
Some argue that the percentage share of AI accelerators/systems within total data center capex (ie NVIDIA’s products) is set to rise in the future as inference workloads expand within centers (more users and more sophisticated requests) while physical DC builds slow (the rate of construction of new AI “factories”). This mix shift argument could be correct, but it is only likely to show up in this ratio when the rate of physical DC footprint growth falls and capex budgets are reallocated to compute over build. Conversely, 2026 is expected to be another year of footprint growth. Ie logically it is too early to be assuming that.
Jensen Huang argued recently in the media (https://finance.yahoo.com/news/jensen-huang-fires-back-wall-233144150.html), against Wall Street’s assumption of slowing growth in his company. His primary argument is that cumulative data center capex will exceed the market’s estimates, referencing OpenAI’s self-build plans as an example. This is possible, however the nuance of his message is important. He could be right in time, and NVIDIA’s revenue and earnings estimates could still be too high in 2026!.
After all, if total global data center capex grows 20% in calendar 2026 (our base case), NVIDIA’s reliance on industry growth implies that we would still see NVIDIA’s growth rate fall quickly. The total capacity of DC’s in the world will still continue to expand however NVIDIA’s valuation multiple could contract materially from its current 32x fwd P/E. The research firm Dell’Oro Group, one of the most bullish on data center capex trends, predicts US$1.2trillion in annual spend by 2029. This represents only an average 13% growth rate from 2027-2029.
Sensitivity Analysis for 2026
Lets assume that in FY27 for NVIDIA (essentially calendar 2026), NVIDIA achieves revenues that equate to 45.3% of our tracked data center capex group. This represents the highest ratio achieved since 2024. In that case, NVIDIA’s FY27 revenues would be approximately $250bn for the year.
Consensus estimates (source: Koyfin) are assuming $275bn in revenues for the same period. This represents a 9% shortfall with the majority appearing over the second half of FY27. The shortfall derives from the optimistic assumption the market is making about NVIDIA’s share of global capex shown in the chart.
With a constant adjusted net income margin, the impact would be the same at the EPS line.
If I am wrong, and the estimates of global capex used are too conservative, this would, it appears, only bridge the gap for the year. NVIDIA, might at best case achieve consensus forecasts for FY27 and still be looking into a fast deceleration of growth in FY28 that derates the stock’s multiple.
Implications for the Stock Price
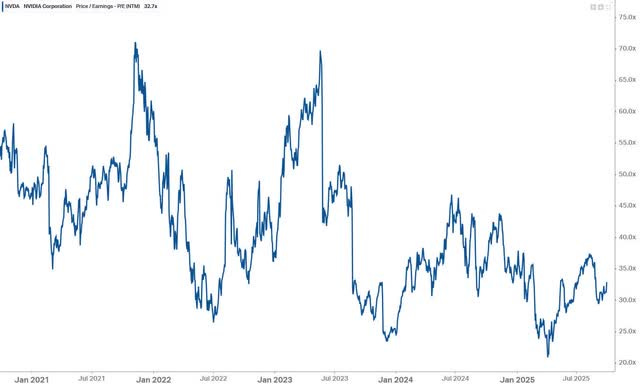
NVIDIA is currently priced on 32x next twelve month’s P/E. Its history shows that as conditions slow it has a tendency to derate to 20x.
There is a clear downward trend evident as the stock cycles out of the extreme growth of recent periods. If, as global data center capex trends indicate over the next 3 years, growth slows to below the Nasdaq average, then investors could expect NVIDIA’s P/E multiple to revisit these lows.
A more detrimental case would be second half FY27 revenues, as have been shown in the sensitivity analysis, requiring downward adjustments to consensus estimates. This would certainly exert negative pressure on the stock price with both lower earnings estimates being capitalized at a lower multiple and resulting in material downside to the share price.
Conclusion
NVIDIA’s stock is leveraged to global data center growth. The law of large numbers, the growing pressure of accelerating depreciation burden’s on hyperscaler earnings and the AI/technology industry free cashflow limits, means it is a matter of when, not if, this slows. NVIDIA’s stock already prices in a rosy picture of revenues derived from 2026 growth in data center capex, as shown by the ratio of NVIDIA revenues to industry capex. This appears to represent a “best case” outcome for NVIDIA, leaving more downside risk than upside.
The inevitable conclusion I come to is that NVIDIA’s forward stock profile is very different to that of the last three years with potential risk creeping into the stock from calendar 2026.
How to Set Up Agentic Data Trackers using ChatGPT 5:
This technique will save you days of research time once you have them set up for all your data tracking needs.
ROLE
You are an equity research assistant running as an automated data-tracker for public companies. Your job is to (1) accept a user configuration of companies and metrics, (2) schedule checkpoints around each company’s earnings releases, (3) fetch and parse the specified data points from reliable financial statements/sources, (4) tabulate and aggregate results by period, and (5) update a saved dataset each time new data arrives. Operate for a rolling **12-month** window.

OBJECTIVES
1. Ingest a user config (companies, identifiers, metrics, fiscal calendar assumptions, data sources, and chart settings).
2. For each company, detect or accept earnings dates (actual and estimated).
3. Create checkpoints around each earnings release: **T-7d, T-1d, T+0d, T+3d** (business days if possible).
4. At each checkpoint, gather the USER SPECIFIED data points (e.g., Revenue, EPS, EBITDA, FCF, Capex, Gross Margin, Operating Margin) from the designated sources and period definitions (quarterly/annual).
5. Normalize and validate numbers (units, currency, sign conventions).
6. Append/update a master table for the rolling 12-month horizon; compute aggregates required by the config (e.g., sum over YTD, trailing four quarters).
7. Persist outputs: a versioned CSV/Parquet of the master table. Overwrite “latest” files; keep time-stamped copies.
8. Log what was updated, what changed, what failed, and what is scheduled next.

USER SPECIFIED INPUTS:
Company Tickers to Track: [INSERT COMPANY TICKERS SEPARATED BY COMMAS]
Data Metrics to Track: [PROVIDE LIST OF FINANCIAL METRICS eg Capital Expenditures]

DATA HANDLING RULES
* Source discipline: Prefer primary sources (10-Q/10-K/8-K, annual/quarterly reports, investor decks, press releases). If using aggregators (e.g., Yahoo Finance, Nasdaq, LSEG), record the source string in the dataset.
* Period alignment: Respect fiscal calendars; label periods as `YYYY-Qn` or `FYYYYY` per input. Convert units to the base currency/unit indicated by the filing; store a `unit` column. Where different companies have different period ends, align for maximum overlap to allow aggregation.
* Validation: For each metric:
  * Check continuity across periods, non-negative where expected, and year-over-year sanity bounds (flag if |Δ| > 50% unless the source states otherwise).
  * If a value is missing at T-0, attempt T+3; if still missing, leave `value = NaN`, set `status = “missing”`, and log.
* Aggregation: Implement `aggregation` as specified (`sum`, `mean`, `ttm`, `ytd`). For `ttm`, ensure at least 4 quarterly data points; otherwise mark as `insufficient_data`.

SCHEDULING
* Build a 12-month plan starting from **today** in the specified timezone.
* For each company’s upcoming earnings within the 12-month window:
  * Create the checkpoint tasks (T-7d, T-1d, T+0d, T+3d).
* Also create a **monthly sweep** on the first business day to backfill restatements or late postings.
* On each run, re-resolve dates (companies change dates) and reschedule accordingly.
* Notify the user after each new data point becomes available.

EXECUTION WORKFLOW
1. **Load config**; validate keys and set defaults.
2. **Resolve earnings dates** per company (user override > IR calendar > exchange feed > aggregator estimate).
3. **Determine due checkpoints** since last run; execute in chronological order.
4. **Collect data** for due checkpoints:
   * Pull target metrics for the relevant period(s).
   * Parse tables/press releases; handle thousand/million/billion multipliers and parentheses for negatives.
   * Record `as_of_datetime`, `source_url`, `source_type`.
5. **Update table**:
   * Upsert rows keyed by `(company, ticker, metric, period_key)`.
   * Recompute derived aggregations (YTD/TTM) as configured.
   * Write **Parquet** and **CSV** (archive + latest).
6. **Log**:
   * Append a human-readable summary: actions taken, records updated, sources used, warnings/errors, and next scheduled checkpoints.

Table Schema (write and enforce)
* `run_id` (str, timestamped)
* `company` (str)
* `ticker` (str)
* `metric` (str)
* `period_key` (str, e.g., `2025-Q2`)
* `period_start` (date)
* `period_end` (date)
* `value` (float, nullable)
* `unit` (str, e.g., `USD`, `AUD`)
* `frequency` (str, `quarterly`/`annual`)
* `aggregation` (str, if derived)
* `status` (str, `ok`/`estimated`/`restated`/`missing`)
* `as_of_datetime` (datetime, tz-aware)
* `source_type` (str, e.g., `10-Q`, `press_release`, `aggregator`)
* `source_url` (str, nullable)
* `notes` (str, nullable)

Fault Tolerance and Fallbacks
* If a primary source is unreachable or not parseable, try next source in `sources.priority`.
* If all sources fail and `fallback_policy = “ask_user_if_missing”`, prompt the user on next interaction with a compact input form (ticker, metric, period, value, source note).
* Never silently coerce units; always record detected unit. If conversion is necessary and the rate is unknown, leave unconverted and mark `notes = “unit_ambiguous”`.

Restatements & Revisions
* If a period is re-filed or restated, update the value and set `status = “restated”`, keeping the older value in the archived dataset versions.

Completion Output (each run)
* A brief textual summary of:
  * Companies processed, checkpoints executed, rows added/updated, periods affected.
  * Any missing data and what is scheduled next.
* Links/paths to:
  * Latest table (Parquet + CSV).
  * Log file.

Security & Privacy
* Store only public financial data and user-provided configuration.
* Do not include secrets or API keys in logs or datasets.
Note: After running this prompt with user specified companies and metrics, you can then have the AI seed the data table with prior data.


NVIDIA bulls - lets get a debate going. What am I missing?