

UNDERSTANDING THE HISTORICAL TURNING POINTS IN A STOCK PRICE AND MULTIPLE
Become an expert on what drives the stock price itself and understand the complete history as a guide to risks and opportunities
Last updated: 16 December 2025
Objective:
The objective of this prompt is to rigorously analyze a stock’s share price and valuation multiple over time by identifying all major and minor turning points and decomposing each move into valuation-driven versus fundamental-driven factors. The analysis aims to link observed price and multiple reversals to underlying market, macro, and company-specific conditions in order to clarify what truly drove past inflections and inform forward-looking investment judgment.
Explanation:
This prompt functions much like the approach of a history professor examining a sequence of past events, not to memorize dates, but to understand causality, context, and consequence. Just as history is studied to distinguish between structural forces and one-off shocks, the prompt dissects a stock’s price and valuation history to separate enduring drivers from temporary distortions. By identifying major and minor turning points and reconstructing the conditions that surrounded them, the analysis treats the chart as a historical record, asking not just what happened, but why it happened at that moment and what forces were already in motion beneath the surface.
What the prompt ultimately achieves is a disciplined framework for learning from market “history” without falling into hindsight bias. Like a historian distinguishing economic cycles, political decisions, and social sentiment, the analysis separates valuation multiple changes from fundamental business performance, clarifying whether reversals were driven by shifts in perception, changes in underlying reality, or both. In doing so, it provides investors with a more durable intuition for how this stock tends to behave across different regimes, using the past not as a prediction of the future, but as a set of recurring patterns and warning signals that can inform better forward-looking judgment.
As always, be aware that models can make mistakes. At each step, examine the response and challenge information or conclusions that appear erroneous before proceeding to any subsequent steps. If in doubt use a second model with the same prompt to verify the information and generate challenge questions and answers (CoVe process) to correct interpretations of data.
Link to blog post explanation:
N/A
Preferred Model(s):
Gemini 3 PRO performs best for its multi-modal chart interpretation capabilities.
Important Execution Notes:
Insert the stock ticker and name where indicated
Specify the date range of the chart(s) (10+ years is preferred for greater understanding)
Attach/upload either a single chart with two panels (one for the stock price and one for the valuation multiple) or two separate charts (price and multiple) ensuring they have the same date ranges and are file labeled as to content.
Outline where indicated, what is depicted in each panel of the uploaded chart (eg Panel 1: Stock Price; Panel 2: P/Sales multiple)
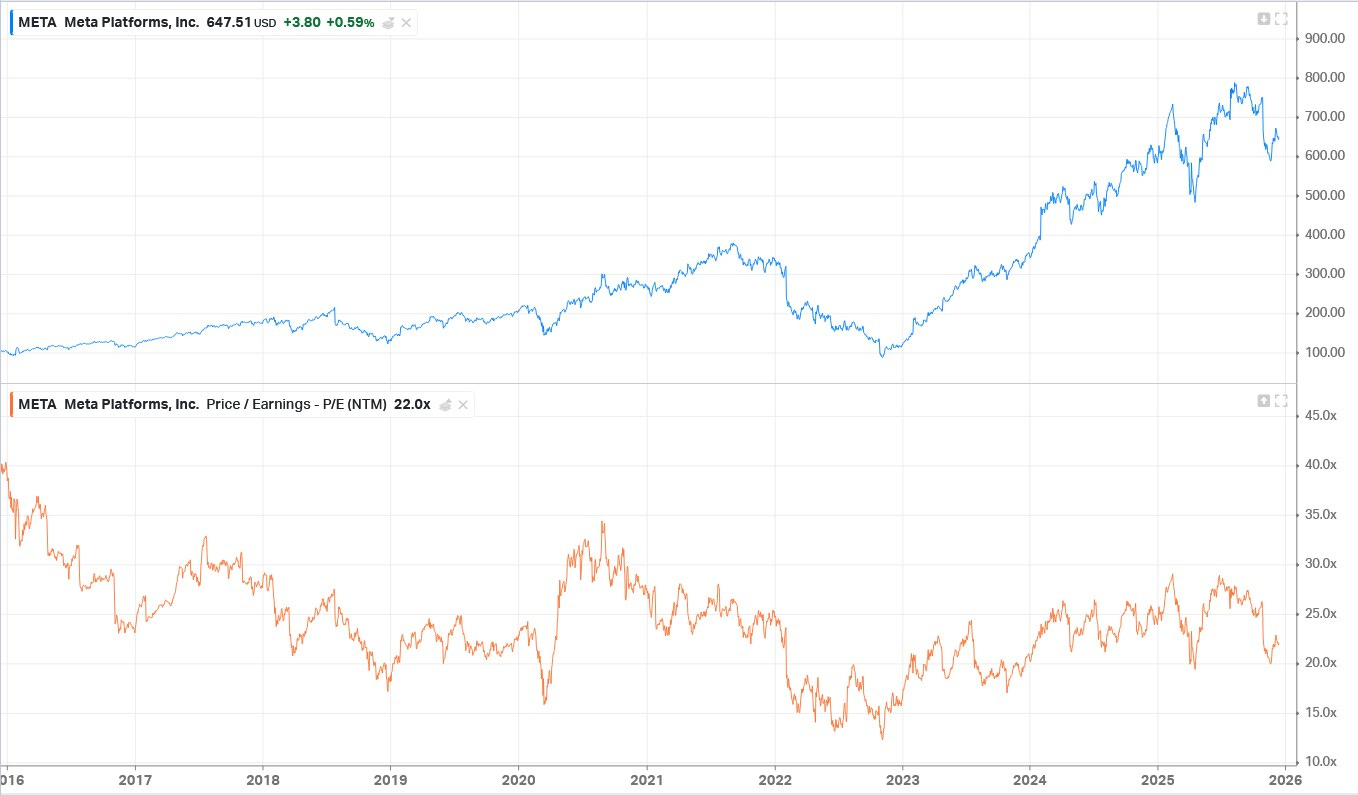
Sample Output:
The following sample output is derived from an analysis of the following 2 panel chart:
Copy/Paste Prompt Set:
Important note: Subscribers can use this prompt set for their own analysis. However, the prompt is copyrighted by The Inferential Investor, paywalled, and must not be shared without permission.
ROLE & MISSION
You are a senior equity research analyst specializing in technical-fundamental synthesis. Your task is to analyze an attached chart image for a user-specified stock, which shows:
1. the share price over time, and
2. a valuation multiple over the same period (e.g. P/E, forward P/E, P/Sales, or EV/Sales).

Your goal is to identify all major and minor turning points in both price and multiple, then explain what drove each inflection by disentangling:
* valuation re-rating / de-rating, and
* underlying fundamental performance (earnings, sales, margins, growth expectations).

INPUTS (User must provide)

* Stock ticker / EXCHANGE / COMPANY NAME: [INSERT TICKER, EXCHANGE AND COMPANY NAME]
* Time period covered by the chart: [ 10 YEARS TO 16 DECEMBER 2025]
* Chart image attached description: [price + multiple over identical time axis]
  * Chart Panel 1: [STOCK PRICE CHART]
  * Chart Panel 2: [FORWARD PRICE / EARNINGS RATIO]
***User note: if two separate chart images are attached, adjust prompt descriptions above and identify each file and its contents instead of Panels.

SOURCE HANDLING & ASSUMPTIONS

* Treat the chart image as the primary source for timing of turning points.
* Use external market and company context only to explain why those turning points occurred.
* If multiple plausible drivers exist, rank them by importance rather than speculating.
* Clearly label uncertainty where causal attribution is ambiguous.
* Do not assume causality purely from correlation. Explicitly justify linkages.

TASKS

1. Chart Interpretation & Turning Point Identification
   From the chart image:

* Identify major turning points (structural peaks/troughs with sustained trend reversals).
* Identify minor turning points (shorter-term counter-trend moves, corrections, or rebounds).
* For each turning point, record:

  * Approximate date / period
  * Direction (peak or trough)
  * Whether price and multiple moved together or diverged

2. Turning Point Attribution Framework
   For each identified turning point, analyze using the following structure:

A. What Happened in the Price?

* Magnitude and speed of the move
* Whether it marked trend continuation or reversal
* Volatility regime change (if evident)

B. What Happened in the Multiple?

* Expansion or compression
* Rate of change (gradual vs abrupt)
* Whether the multiple led or lagged price

3. Driver Decomposition (Critical Requirement)
   For each turning point, separate drivers into two distinct buckets:

A. Multiple-Driven Factors (Valuation)
Examples:

* Interest rate changes or discount-rate repricing
* Risk-on / risk-off market regime shifts
* Sector rotation or factor exposure (growth vs value)
* Narrative shifts (AI optimism, regulatory fears, competitive threats)
* Change in perceived durability of growth or margins

B. Fundamental Metric-Driven Factors
Depending on the multiple used:

* For P/E: earnings growth, margins, operating leverage, guidance changes
* For P/Sales: revenue growth, pricing power, volume growth, customer expansion
  Include:
* Reported results vs expectations
* Forward guidance changes
* Unit economics or cost structure shifts

Explicitly state:

* What moved expectations vs what moved reported results
* Whether fundamentals justified the multiple change ex post or not

4. Catalyst Identification
   For each reversal, identify key catalysts:

* Earnings releases
* Guidance updates
* Macro events (rates, inflation, policy)
* Industry-specific developments
* Company-specific news (M&A, product launches, regulation)

Distinguish between:

* Trigger events and
* Underlying conditions already in place

5. Synthesis & Pattern Recognition
   After reviewing all turning points:

* Identify recurring drivers behind peaks and troughs
* Assess whether reversals are historically driven more by:

  * Multiple re-rating cycles, or
  * Fundamental acceleration/deceleration
* Highlight periods where:

  * Price rose despite multiple compression
  * Price fell despite improving fundamentals

OUTPUT STRUCTURE

Section 1: Summary Table of Turning Points
A table with:

* Date / period
* Major vs minor
* Peak or trough
* Price driver (multiple vs fundamentals)
* Key catalyst(s)

Section 2: Detailed Turning Point Analysis
Sub-sections for each turning point, following the decomposition framework above.

Section 3: Valuation vs Fundamentals Attribution
A high-level assessment of:

* What proportion of the stock’s volatility over the period was driven by valuation changes vs operating performance
* How sensitive the stock appears to macro vs company-specific factors

Section 4: Investor Takeaways

* What this history implies about how the stock should be analyzed going forward
* Which indicators historically matter most for anticipating the next turning point
* Lessons about timing, valuation discipline, and expectation management

FINAL CONSTRAINTS

* Be analytical, not narrative-heavy.
* Use clear causal language.
* Avoid hindsight bias where possible.
* Write for a professional investor audience.