Risk-On / Risk-Off: The Equity Risk Regime Monitor 4th May 2026
What are the movements in macro sensitive equities telling us about markets?

The following report was generated with the Equity Risk Regime research workflow from the INFERENTIAL INVESTOR.
Important Disclaimer: The following stock discussion and analysis is subject to The Inferential Investor’s Disclaimer. It is an indicative and educational exploration of advanced techniques for AI in investment research and does not make or imply any investment recommendations in any security mentioned.
MARKET RISK REGIME ANALYSIS
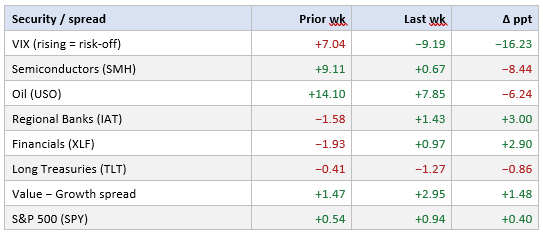
Cross-Asset Signal Map | May 4, 2026
Headline equity benchmarks were modestly higher in both of the past two weeks. The S&P 500 rose 0.54% in the week to 24 April and another 0.94% in the week to 1 May, with the Nasdaq Composite and S&P 500 each closing at record highs on Friday. On the face of it, that looks like continuity. Look one layer down and the composition of the move changed almost completely. The dominant macro variable for the cross-section pivoted from the Iran / Strait of Hormuz oil-shock probability to the policy reaction function around an unwelcome inflation print. The behavior of equities, sectors, factors, rates, currencies, commodities and volatility reflects that pivot.
This note summarizes what changed, why it may have changed, and what the cross-asset evidence could imply for the equity risk regime over the near-term horizon. Forward outcomes are inherently uncertain. Nothing here is a recommendation to buy or sell any security.
Headline movers, week-on-week
Reference dates: Friday closes on 17 April, 24 April and 1 May 2026. “Prior” refers to the week ending 24 April, “Last” to the week ending 1 May. All figures are in percent (or percentage-point change for the spread).
Newsflow pivoted
The prior week was framed by the Iran conflict. By Tuesday 22 April Brent had moved back above USD 100 per barrel for the first time in roughly two weeks, as proposals to re-open the Strait of Hormuz failed to gain traction. The semiconductor complex was running its own parallel story: Intel’s strong print on 23 April catalyzed a continuation of an already extraordinary rally — the iShares Semiconductor ETF posted its 18th consecutive positive session on Friday 24 April, with NVIDIA’s market capitalization crossing USD 5 trillion intraday. The University of Michigan Consumer Sentiment final April reading printed at 49.8 — the lowest in the series’ history dating to 1952 — and yet had limited apparent equity-market impact at the index level. Indices made fresh highs while the VIX rose for the week, which would be consistent with index-level optimism layered with hedging at the option level.
The week to 1 May was much busier on the macro and policy side. The U.S.–Iran negotiations broke down over the weekend of 25–26 April; Brent reopened around USD 107–108 on Monday and the Strait of Hormuz remained well below pre-war traffic levels. On Tuesday, the Wall Street Journal reported that OpenAI’s revenue and user growth had fallen short of internal targets, with the CFO reportedly raising concerns about the firm’s ability to meet computing-contract commitments — the semiconductor complex sold off roughly 3% on the day. The same day the United Arab Emirates announced its exit from OPEC+ effective 1 May, introducing an additional supply-side variable into the oil complex.
Mid-week was dominated by the policy and earnings axis. Four hyperscalers — Microsoft, Amazon, Alphabet and Meta — reported after the close on Wednesday. Alphabet’s Google Cloud growth of approximately 63% year-on-year drove its shares up roughly 10%; Microsoft (Azure approximately 40%) closed lower by approximately 4% on capex-intensity concerns; Meta closed lower by approximately 9% after raising its 2026 capex guide to USD 125–145 billion (from USD 115–135 billion); Amazon was approximately flat-to-positive. All four raised capex guidance. Apple followed on Thursday with a fiscal-Q2 beat and constructive guidance, sending shares roughly +3% on Friday.
Also on Wednesday 29 April the FOMC voted 8–4 to hold the funds rate target at 3.50–3.75%. The breadth of dissent was the most pronounced since October 1992. Governor Miran dissented in favour of a cut; Presidents Hammack (Cleveland), Kashkari (Minneapolis) and Logan (Dallas) dissented against the inclusion of an easing-bias in the statement. CME FedWatch implied probabilities for a higher funds rate at the December meeting moved from approximately 0% to approximately 9% intraday, and Treasuries sold off across the curve. Chair Powell confirmed his Chair term ends 15 May; Kevin Warsh’s nomination as Chair advanced through the Senate Banking Committee that same morning.
Thursday 30 April brought the data. Q1 2026 advance GDP printed at +2.0% annualised — below the +2.3% consensus and well above the +0.5% Q4 2025 outturn — but the inflation side surprised firmly to the upside. The Q1 PCE price index accelerated to +4.5% (from +2.9%) and core PCE to +4.3% (from +2.7%). Public commentary attributed the impulse to a combination of energy pass-through from the Iran-related supply disruption and tariff effects. Growth slightly soft of expectations alongside an upside inflation surprise has stagflation-flavoured implications for the policy reaction function.
What the cross-section is saying
Volatility compressed, but on a thinner hedge
The single most informative signal is the change in the daily SPY–TLT correlation: it fell from approximately +0.91 in the week to 24 April to approximately +0.02 in the week to 1 May. The week before, equities and long-duration Treasuries moved largely in tandem on a daily basis — Hormuz risk was the shared pricing variable for both. Last week the variables split. Equities ground higher on the fading geopolitical tail and the Apple / Alphabet earnings impulse, while bonds sold off on the hawkish FOMC dissent and the upside Q1 PCE print. Long Treasuries did not provide their usual portfolio-hedge function during the equity rally.
Realised S&P 500 volatility fell from approximately 11.7% to 8.5% annualised, and the VIX swung 16 percentage points lower week-on-week. That pattern would be consistent with the market discounting some of the most acute geopolitical tail risks. It is worth noting, however, that volatility compression after an unresolved tail event has historically been associated with subsequent expansion if the underlying risk re-asserts. The Hormuz situation is not resolved at the time of writing.
Stocks–bonds decoupled & the Treasury curve bear-steepened
All three Treasury proxies declined last week, with the long end (TLT, −1.27%) underperforming both short-duration (SHV, −0.24%) and inflation-linked (TIP, −0.40%). The TLT–SHV spread widened from −0.48 to −1.03 percentage points, indicating a meaningful bear-steepening of the curve. TIPS modestly outperformed nominal long Treasuries (the TIP–TLT spread, a directional but imperfect breakeven proxy, widened by approximately 17 basis points). The configuration would be consistent with the market repricing toward a higher-for-longer policy stance, with a stickier-than-transitory inflation profile embedded in the curve. The U.S. Dollar Index (DXY) moved from +0.42% to −0.30%, an unusual signal alongside higher long yields and one that may suggest some marginal easing of the foreign safe-haven bid for U.S. duration.
Cyclicals and Defensives — both worked
The most unusual feature of the cross-section is the simultaneous strong performance of cyclicals and defensives. Regional Banks (IAT) reversed from −1.58% to +1.43% — a 3.0 percentage-point swing — and Financials (XLF) posted a 2.9-point sequential improvement, moves that are consistent with a curve bear-steepening that is generally net-positive for traditional bank net interest margins. Industrials and Consumer Discretionary improved as well. Yet at the same time, Healthcare Providers (IHF) gained 3.4%, Staples (XLP) gained 1.1%, Utilities (XLU) gained 0.8% and Low Volatility (USMV) gained 0.5%. That pattern is unusual because cyclicals and defensives typically move inversely.
Several interpretations are consistent with the signal. Market participants may be hedging strong cyclical exposure with defensive overlays. There may be institutional rebalancing into rate-sensitive defensives. Or the combined signal could reflect a barbell positioning: leaning into cyclical recovery while maintaining a quality-and-yield buffer against potential stagflationary outcomes. The breadth of the defensive bid — including +3.4% in Healthcare Providers, a sector with idiosyncratic regulatory and reimbursement drivers — suggests it is unlikely to be purely flow-driven.
Semiconductor leadership took a step back
The 8.4-percentage-point sequential deceleration in the iShares Semiconductor ETF (SMH +9.11% the prior week, +0.67% last week) is one of the most pronounced relative-momentum reversals in the dataset. The OpenAI revenue-shortfall report on 28 April provided the proximate catalyst, but the structural feature is more nuanced: hyperscaler capex guidance for 2026 was uniformly raised across all four reporting names, which is fundamentally net-positive for semiconductor end-demand. The deceleration may therefore reflect valuation digestion and rotation rather than a thesis revision on AI infrastructure spending. The combined message — capex up, semiconductor relative performance down — would be consistent with a market that continues to price the AI capex cycle but is becoming more discriminating about which beneficiaries it is willing to own at current valuations.
Breadth, value, small-cap
Equal-Weight S&P (RSP) shifted from underperforming the cap-weighted index to outperforming the trend, the Russell 2000 (IWM) accelerated, and the Nasdaq 100 (QQQ) decelerated relative to the S&P. The Value − Growth spread widened by approximately 1.5 percentage points in favour of Value, the largest single factor-level move in the universe. Momentum (MTUM) gave back relative ground to Quality (QUAL) — consistent with the fact that recent momentum cohorts had been dominated by the very semiconductor and AI-adjacent names that subsequently corrected.
What the cross-section says about inflation and growth
The relative movements of macro sensitive equities and asset calsses can act as a forward indicator of the inflation-versus-growth balance:
• Inflation signals: the bear-steepening of the Treasury curve, the relative outperformance of TIPS within fixed income, the persistent strength of broad commodities (DBC) over both weeks, and the financial-sector reversal would collectively be consistent with the market pricing in a higher-for-longer or modestly higher inflation path. The +4.5% Q1 PCE print provided fundamental support for this read.
• Growth signals: the small-cap and equal-weight breadth improvement, the cyclical sector reversal, the credit-sensitive regional bank reversal, and the Value-factor outperformance would collectively be consistent with the market pricing in firmer near-term growth than was reflected in the prior week. The +2.0% Q1 GDP print, while a miss versus consensus, is not a recessionary signal.
• Tension and qualifying factors: the simultaneous defensive bid, gold and gold-miner declines (which would typically not occur in a clean reflationary regime), and the semiconductor deceleration introduce contradictory signals. The cross-section is best characterized as a market that has shifted toward a mildly stagflationary base case (firm growth, sticky inflation) rather than a clean reflation or recession trade.
Considerations for the equity risk regime and appetite
Putting the pieces together, the implied near-term equity risk-appetite reading would be consistent with cautiously constructive — that is, market participants appear willing to take incremental equity exposure but with a more pronounced rotation away from concentrated leadership and toward broader participation. The modest positive S&P 500 return last week, the simultaneous improvement in equal-weight breadth, the small-cap acceleration, and the volatility compression all point in that direction. The credit-style signal from regional banks (improvement, but only modestly above the index) and the persistence of defensive sector strength suggest the appetite is calibrated rather than aggressive.
A few practical implications could follow from such a regime. Long-duration equity multiples may face headwinds from a higher real-yield path; the Nasdaq 100’s relative deceleration last week may already reflect early signs of this dynamic. Cyclical and value-factor exposure may benefit from the bear-steepening to the extent that net-interest-margin-sensitive financials and shorter-duration cash-flow profiles are rewarded. Portfolio diversification benefits from long-duration Treasuries may be temporarily diminished — not a structural change, but a meaningful consideration over the near-term horizon.
Catalysts that could shift the regime are clustered into the next several weeks. A renewed Iran / Hormuz escalation could re-establish the prior week’s dynamics — oil higher, VIX higher, stocks–bonds correlation rising again. The April CPI and PCE prints will test whether the Q1 inflation acceleration was largely driven by the temporary energy spike or is more entrenched. Non-farm payrolls on 8 May and subsequent ISM data may either confirm or revise the +2.0% Q1 GDP signal — a meaningful labor-market softening could revive the duration hedge function and shift the regime back toward growth concerns. The Fed leadership transition on 15 May, and the period through to the June FOMC meeting, introduces communication-tone risk; public commentary on Kevin Warsh suggests a generally dovish disposition. NVIDIA’s quarterly print (typically mid-to-late May) and any further OpenAI-cohort newsflow may sustain or unwind the semiconductor deceleration.
Bottom line
The two weeks under review may be summarized as the market migrating from pricing an acute, growth-negative geopolitical shock toward pricing a more nuanced stagflation-test. The cross-section displays genuine cyclical reversal alongside meaningful defensive participation, the breakdown of stock–bond co-movement, and the deceleration of recent leadership cohorts. Such a regime could remain supportive of broader equity beta on a near-term horizon but may also be associated with elevated factor and sector dispersion, more limited duration-hedge protection, and heightened sensitivity to subsequent inflation prints. It is also a regime that has historically been more sensitive to single-headline reversals than is typical for either pure risk-on or pure risk-off backdrops. The patterns identified are descriptive of price behavior over a two-week window. They are not predictive.
Disclaimer
This article is for informational and educational purposes only. It does not constitute investment advice, a recommendation to buy or sell any security, an offer or solicitation, or a guarantee of future performance. The information is derived from sources believed to be reliable but no representation or warranty is made as to its accuracy or completeness. All references to specific securities are illustrative. Past performance is not indicative of future results. Readers should consult their own advisers before making any investment decision.
All comments or feedback appreciated on this report format.
Andy West
The Inferential Investor