

Now that's a (Way)fair Turnaround
Earnings Call Transcript Analysis for Wayfair Q3 result

This report was generated using THE INFERENTIAL INVESTOR’S Earnings Transcript Analysis Report workflow which draws upon LLMs latest capabilities in natural language processing to extract insightful signals from transcripts and show the trends and evolution of those through time to give investors a very tangible understanding of the business and how its changing. Where numbers appear in brackets in the report “[163]”, this indicates a citation that in the live output would be linked to source for easy verification.
Wayfair is a textbook case of a business that has just past an important fundamental inflection point…

Wayfair Inc. ($W US) - Transcript Analysis Report Q3 2025
1. Executive Summary
Wayfair’s narrative across 2025 has transformed from defense to offense, marked by accelerating structural growth and significant margin expansion despite a “stubbornly sluggish” macro environment.
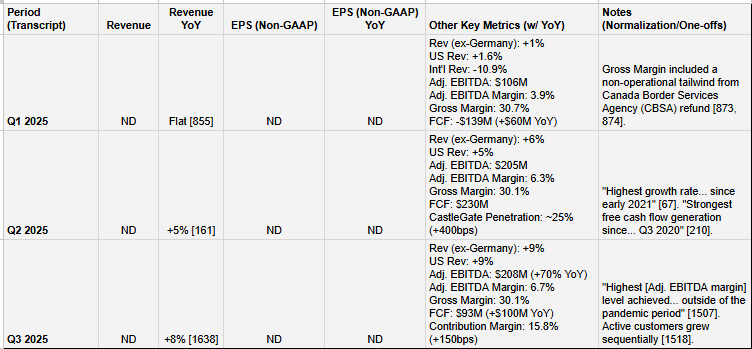
Accelerating Share Gains: Revenue (ex-Germany) growth accelerated sequentially through each quarter, from +1% in Q1 to +6% in Q2, and +9% in Q3. Management attributes this entirely to structural share gains, not macro recovery or tariff pull-forward.
Consistent Profit Beats: Wayfair beat its quarterly Adjusted EBITDA margin guidance in Q2 and Q3. Adj. EBITDA margin expanded from 3.9% in Q1 to 6.3% in Q2, and 6.7% in Q3, the highest outside the pandemic.
From Tariff Defense to Tech Offense: The Q1 call was dominated by a defensive discussion of how Wayfair’s marketplace model insulates it from tariffs. By Q3, tariffs were an afterthought, replaced by a strategic presentation from the CTO on how AI and a completed multi-year re-platforming are now driving growth.
New Profit Levers Emerging: Management introduced “multi-channel fulfillment” in Q2, a 3PL service for suppliers that is accretive to margins. The focus has also shifted to “Contribution Margin” (Gross Margin - CS&M - Advertising), which hit 15.8% in Q3.
Advertising Leverage: Ad spend as a percent of revenue improved significantly to 10.6% in Q3. While management flagged this as artificially low due to “one-time” tests, the trend is positive.
Bullish 2026 Outlook: Management provided an initial 2026 framework, stating they “plan to invest judiciously to grow the business at a rapid pace while growing adjusted EBITDA faster than revenue.”
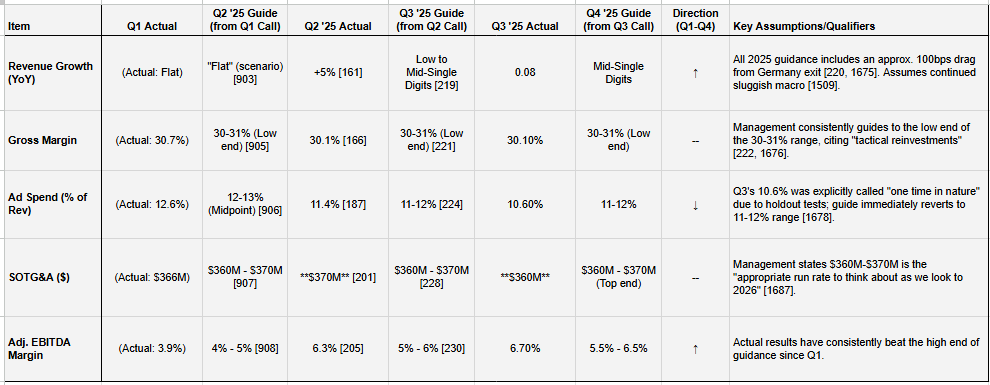
SOTG&A Discipline: Fixed costs (SOTG&A) have been held in a tight $360M-$370M range, creating powerful flow-through as revenue grows.
Capital Structure Improved: Net leverage (TTM) has fallen from over 4.0x to 2.8x. The company has actively retired 2025, 2026, and 2028 notes, clearing the runway.
Macro Still a Headwind: Management is “not reliant upon a recovery in the housing market” and states the category remains “flat to down low-single digits.”
Key Risk: The exceptional 10.6% advertising leverage in Q3 was explicitly called “one time in nature,” with guidance returning to the 11-12% range for Q4.
2. Table 1: Results & YoY Growth
Metrics disclosed in Earnings call only
3. Table 2: Guidance & Long-Term Goals Evolution
Long-Term Goals & Gap Analysis
Q1 2025:
Goal: Reach 300-400 basis points of revenue penetration for supplier advertising [817].
Gap: Current penetration was >150bps at YE’24 [805]. Requires a ~2x increase.
Q2 2025:
Goal: Maximize EBITDA and free cash flow over the long-term [65]. Reach 10%+ adjusted EBITDA margins (reiterated from 2023 Analyst Day) [310].
Gap: Current Q2 margin was 6.3% [205]. Requires ~370bps+ of further expansion.
Q3 2025:
Goal (New): For 2026, “grow adjusted EBITDA faster than revenue” [1697].
Gap: This is already being achieved in 2025 (e.g., Q3 revenue +8% vs. Adj. EBITDA +70% [1506, 1638]). The goal is to maintain this positive operating leverage.
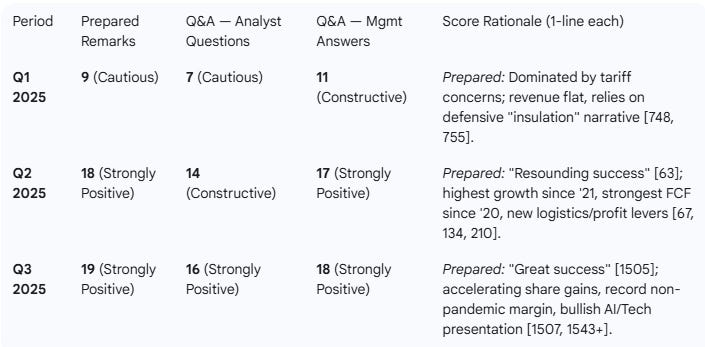
4. Table 3: Sentiment (0–20 Scale)
5. Thematic Summary (Prepared Remarks)
Q1 2025 (May 1, 2025)
Dominant Theme (Risk): Tariffs. The call opened with tariffs being “top of mind” [748].
Strategy (Defense): Management spent significant time explaining how its model provides insulation:
Marketplace Dynamics: 20,000+ suppliers compete for orders, incentivizing them to absorb costs to win share.
Sourcing Diversity: Suppliers manufacture in over 100 countries, including a “substantial base” in the US.
New Initiatives: Supplier advertising was highlighted as a growth driver, reaching >150bps of revenue in 2024 with a goal of 300-400bps.
Capital Structure: Highlighted a strengthened balance sheet after refinancing 2026 notes and extending its revolver, positioning Wayfair to “play offense”.
Q2 2025 (Aug 4, 2025)
Dominant Theme (Performance): “Resounding success” [63]. The narrative shifted from defense to offense, highlighting the “highest growth rate... since early 2021” [67] and “strongest free cash flow generation since... Q3 2020”.
Margin Framework: Introduced the “Contribution Margin” concept (GM - CS&M - Ad Spend) as a key metric, which hit 15.2%.
Strategy (Logistics): Deep dive on CastleGate as a “key competitive moat” [108]. Penetration hit ~25%, up 400bps YoY.
New Initiatives (Logistics): Announced the expansion of CastleGate into a multi-channel 3PL service for suppliers, which is “accretive to adjusted EBITDA margins”.
Core Growth Drivers: Attributed success to new initiatives (Verified, Rewards, Physical Retail) [89-98] and tech re-platforming efforts “bearing fruit”.
Q3 2025 (Oct 28, 2025)
Dominant Theme (Technology & AI): CTO Fiona Tan joined the call for a deep dive on AI [1539]. The multi-year tech re-platforming is “largely complete”, enabling faster innovation.
AI Strategy (3 Pillars):
Reinvent Customer Journey: Using GenAI for inspiration (Muse, Discover tab) and personalization.
Supercharge Operations: Using AI for catalog enrichment, service agent “copilots,” and fraud detection.
Power Ecosystem: Using LLMs to scale SEO and prepare for “agentic commerce” on platforms like Google and OpenAI.
Performance: “Great success” with “share gain further accelerated” to +9% (ex-Germany) [1505], driven by +5% order growth.
Profitability: Record non-pandemic Adj. EBITDA margin of 6.7% [1507], driven by a 15.8% Contribution Margin and ad spend leverage at 10.6% of revenue.
Capital Structure: Net leverage (TTM) reduced from >4x to 2.8x [1667]. Repurchased a portion of 2028 notes.
6. Analyst Q&A Themes & Evolution
Q1 2025:
Theme: Almost exclusively tariffs, pricing, and pull-forward.
Analyst Focus: How much will suppliers raise prices? Is there any sign of consumer pull-forward demand ahead of tariffs? Are suppliers raising prices on other platforms first? How much of a headwind was the CastleGate inventory “rush” in Q1?
Management Response: Suppliers are “very wary to raise prices” due to intense platform competition and the substitutable nature of goods. Pull-forward is “de minimis” and isolated to large appliances. The platform model is a structural advantage in this environment.
Q2 2025:
Theme: Sustainability of the growth and margin beat.
Analyst Focus: Is the +6% (ex-Germany) growth structural or a tariff-related pull-forward? [251] How do you get from a 6.3% EBITDA margin to the 10%+ long-term goal? (The “profitability ladder”) [302]. Was the Q4 ‘24 marketing spend (TikTok, etc.) responsible for this new growth?.
Management Response: “Our strength is structural”. Growth is driven by the “three pillars”: 1) Core recipe, 2) New programs (Rewards, Verified), and 3) Tech re-platforming [273-299]. The path to 10%+ margins is via optimizing “Contribution Margin” and leveraging fixed SOTG&A.
Q3 2025:
Theme: 2026 outlook, AI impact, and the source of acceleration.
Analyst Focus: What is the 2026 outlook for lapping these share gains? [1729] Is the industry backdrop itself improving, or is this all Wayfair? [1836] How will “agentic shopping” (AI agents) change the paid search model? [1803] How much is GenAI actually contributing to share gains today? [2015]
Management Response: 2026 will see “EBITDA growth... definitely outpace revenue growth” [1734]. Growth is “not reliant upon a recovery in the housing market” [1511]; it is “structural” [1937]. GenAI is still in the “first inning” [2021] and has not played a big role in past share gains, but will be a key future driver.
Evolution Summary: The Q&A focus shifted dramatically from Q1 (defensive, macro/tariff risk) to Q3 (offensive, structural growth, long-term tech strategy). Analysts’ questions evolved from “Can you survive?” to “Is this sustainable?” to “How high is high?”
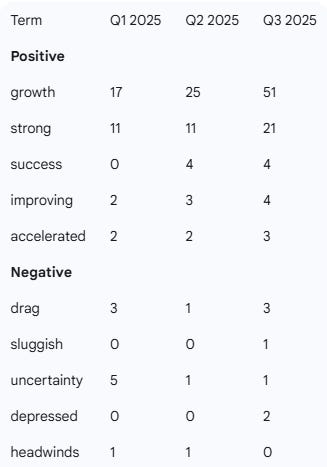
7. Term Frequency Tracking
Frequency of key positive/negative terms identified in the Q3 2025 transcript, tracked across all three periods.
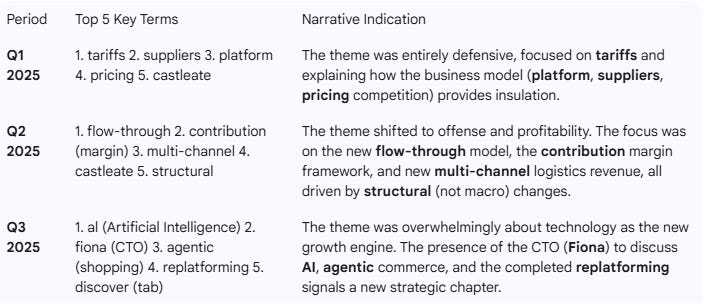
8. TF/IDF Key Term Evolution (Top 5)
TF/IDF (Term Frequency-Inverse Document Frequency) highlights terms that are uniquely important to each specific transcript, revealing the central theme.
9. Red Flags & Open Questions (from Q3 2025 Transcript)
One-Time Ad Leverage: Management was explicit that the Q3 ad spend of 10.6% of revenue was “one time in nature” [1657, 1678] due to “holdout tests” [1657]. They immediately guided Q4 back to the 11-12% range [1677]. This signals that 10.6% is not the new sustainable run rate.
New Recurring SBC: The company disclosed a new CEO performance award that will add “~$20 million” to equity-based compensation expense each quarter going forward [1689-1690]. While this is non-cash, it is a new, recurring add-back for Adjusted EBITDA and non-GAAP EPS calculations.
Transcript Typo: The Q4 2025 CapEx guidance is stated as “$55 million to $55 million range” [1692], which is a clear typo. This is likely meant to be “$55 million to $65 million,” consistent with the Q2 guidance for Q3 [233], but should be verified.
Guidance vs. Momentum: While Q3 revenue growth accelerated to +9% (ex-Germany), the Q4 guidance is for “mid-single digits” [1675], implying a sequential deceleration. This may be conservatism, but it contrasts with the otherwise bullish “accelerating share gain” narrative.
Do you want me to adjust any of the metrics in this AI generated output and have the report updated?
I can also provide, using the proprietary prompts from The INFERENTIAL INVESTOR:
Detailed earnings transcript analysis
A comprehensive Equity Research Report
Financial statement analysis with red flags and forensic checks
Segment Performance Breakdown — show revenue/EPS by business unit.
A comprehensive initiation report on the stock
Specialist industry analysis