


What’s an inflection point and why are they important for stock prices? An inflection point occurs when a stock moves from one phase in their cycle to another. Some examples:
Positive: An industrial stock has been experiencing deteriorating conditions for a couple of years, however demand stabilizes, excess supply has washed out, revenue growth returns and margins rebound.
Positive: A consumer brand has been undergoing a turnaround after a lengthy period of declining sales. Management has been replaced, they have had time to restructure and introduce a new strategy, new products have been launched and demand starts to return.
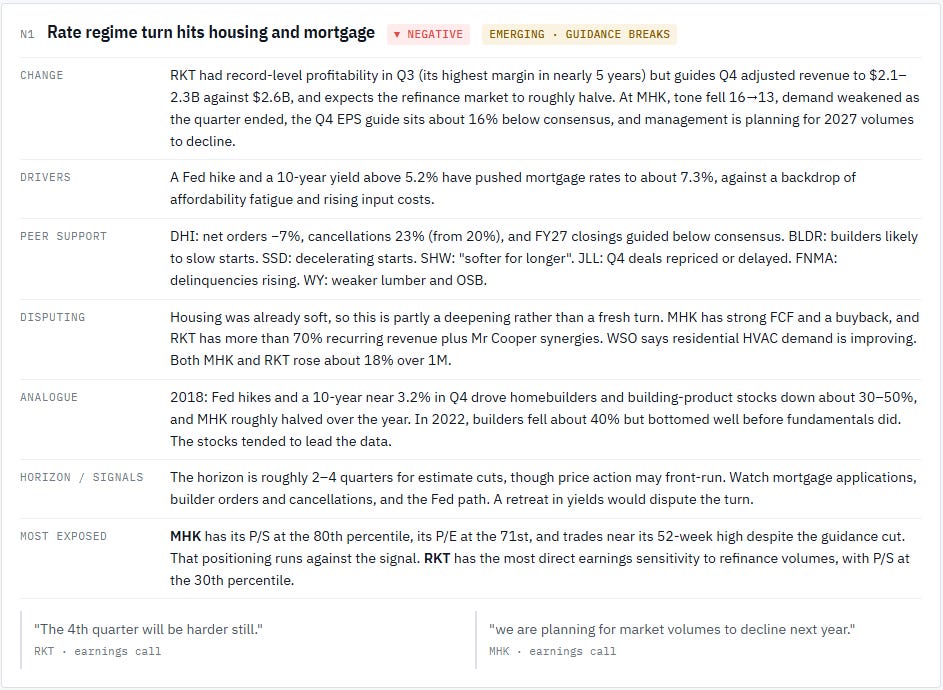
Negative: Home builders may have benefited from reduced interest rates driving renewed housing demand over a 2 year period. However inflation returns, rates are increased by the Fed and demand stops dead. This leads to a period of reduced inquiry, sales and earnings with industry discounting to clear inventory.
Inflection points are occurring all the time across a broad stock market but can be difficult to identify at the right time as they can appear slowly with limited initial, or even conflicting evidence in the early stages. However they can be the single largest driver of alpha for investors because of two coalescing forces:
Fundamental surprise: Consensus follows the trend and estimates lag inflection points. When conditions change, consensus is usually left expecting a continuation of past positive or negative trends. This results in a period of extreme positive (or negative) surprise in revenues, margins and earnings. That surprise drives stock returns.
Multiples shift quickly: After a protracted period of one set of conditions, a stock becomes crowded and this is usually seen by the stock’s valuation multiple sitting 1 or 2 standard deviations from its long term average. When conditions change, investors who are all positioned on one side of the boat, rush to the other side. This means that there is concentrated buying (or selling if conditions negatively inflect) that pushes the stock’s valuation multiple very quickly from, say -1 standard deviation to +1 to +2 standard deviations.
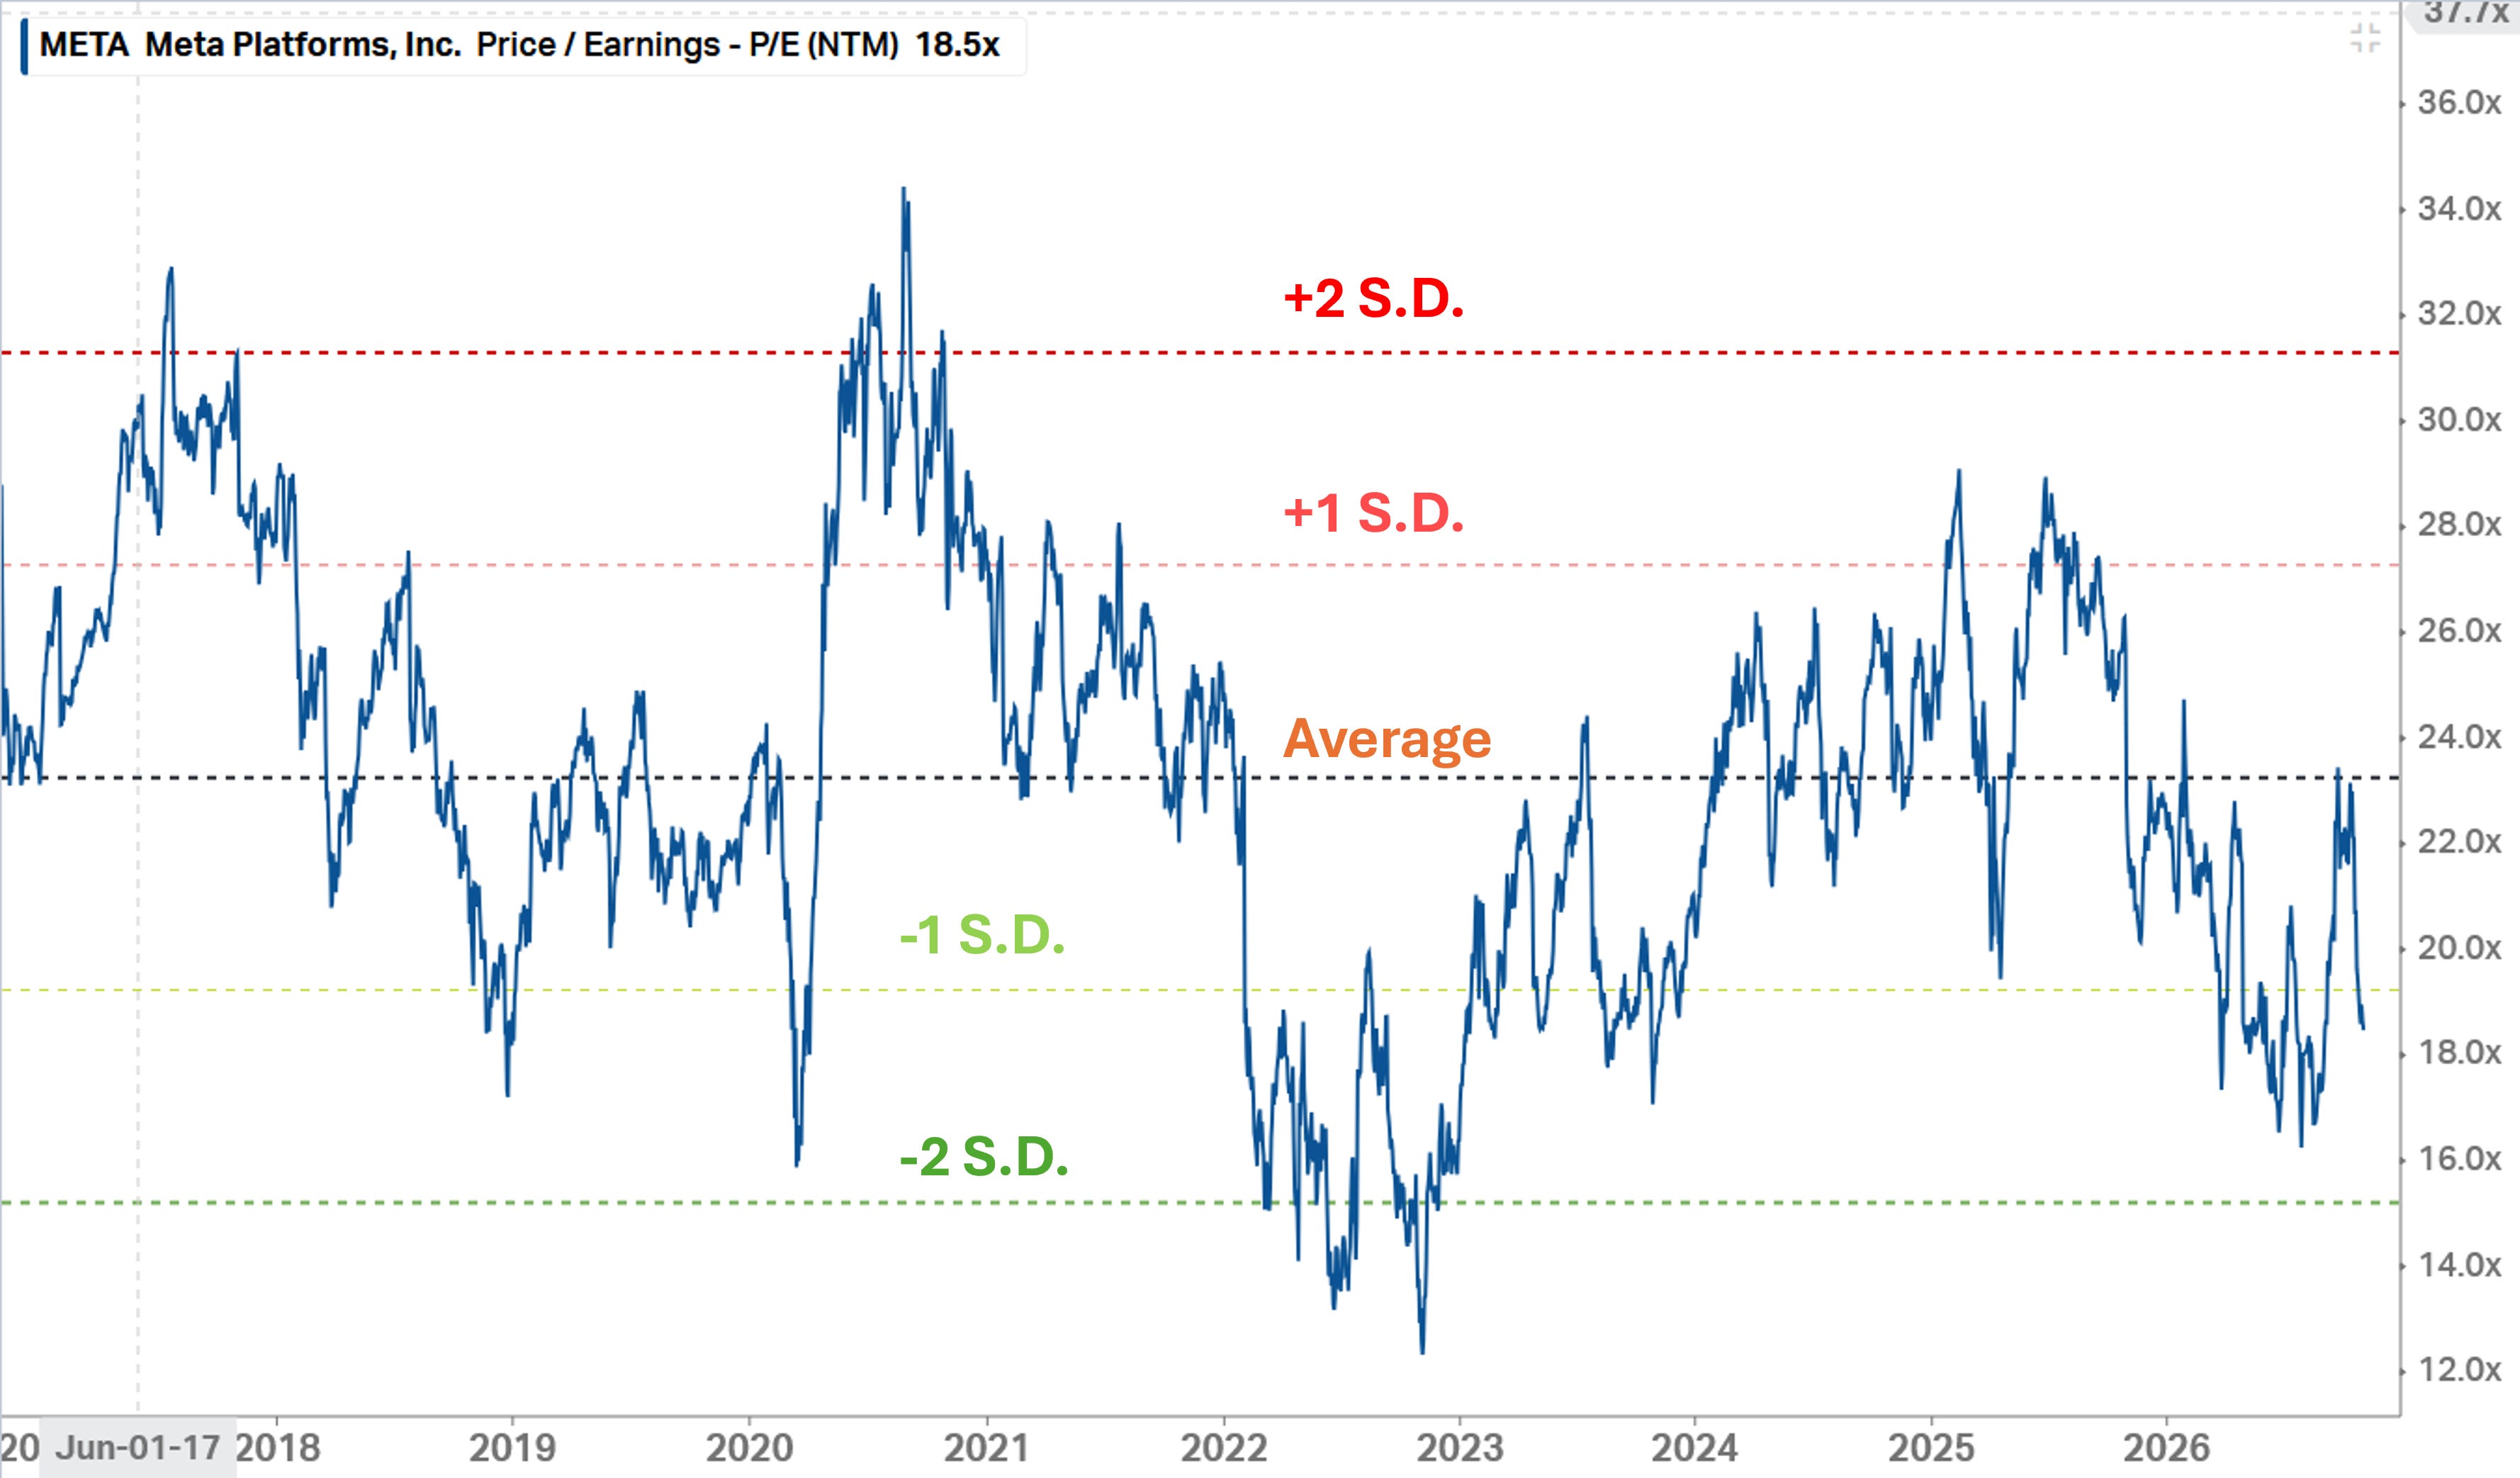
The Meta example: You can see in the above chart for Meta how its multiple rarely dwells around the average. Instead it passed through the average on trended moves from one extreme to another. These moves are large in magnitude and occur over a full cycle. Between 2022 and 2025, Meta moved from 15x forward earnings to nearly 30x at the same time as earnings grew, exceeded consensus estimates generating positive upward earnings drift.
Hopefully you can see what I am getting at here.
The strongest alpha = Fundamental Surprise x Multiple Re-rate / de-rate.
When earnings grow 40%-50% across 2 years and the multiple doubles, the return on offer compounds well ahead of the underlying earnings growth rate. In the case described, the return would be in the order of 200% over 2 years.
However to capture those opportunities, investors need to be looking forward for fundamental inflection points.
This is where a system like Inferent can assist as the earliest evidence of inflection points is not quantitative - it is contextual.
If you wait till the fundamental shift is showing up in financial results, it is too late. The earliest signals are in management language, discussion of changing conditions, competitive environment, peer company statements etc. You amass that evidence with (1) speaking to companies and (2) contextual distillation of large volumes of data.
It is that last step where Inferent Analyst is designed to assist. As an agentic analyst, Inferent’s system is being designed to constantly analyze stock specific events; extracting signals, drivers, sentiment indicators and correlating that data across a knowledge graph of peers, competitors, suppliers and customers. That activity is a big differentiator to most investment data terminals and even AI-enabled investment platforms. Because Inferent is processing and generating value added analysis (not just summaries), it builds context of conditions and can detect change.
Inflection Points from Recent Earnings
The following represents a contextual screen - an initial examination of stocks that meet a set of criteria. These are not stock recommendations as more complete investigation into each is required to form a verified thesis. It represents the contextual version of any traditional stock screen you may have used previously via a data terminal.
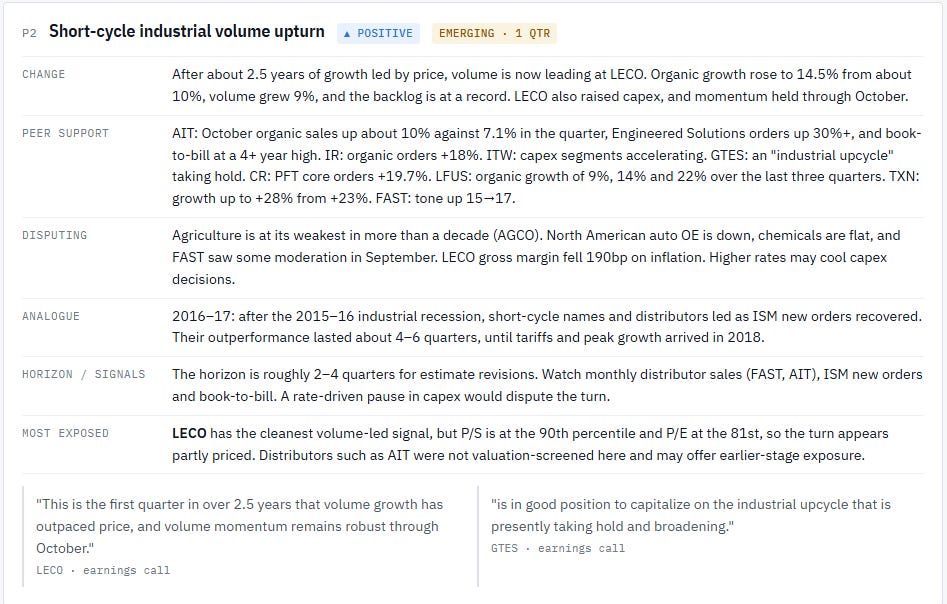
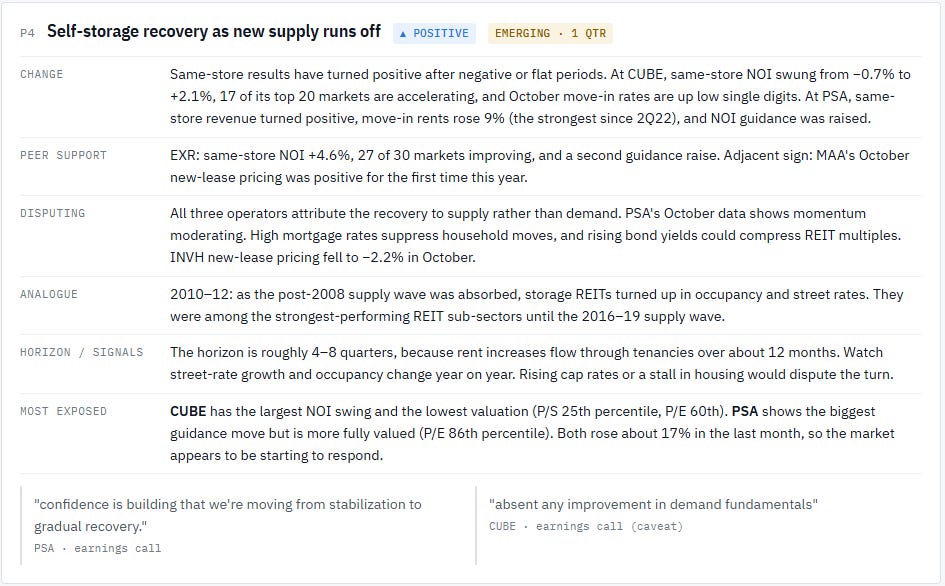
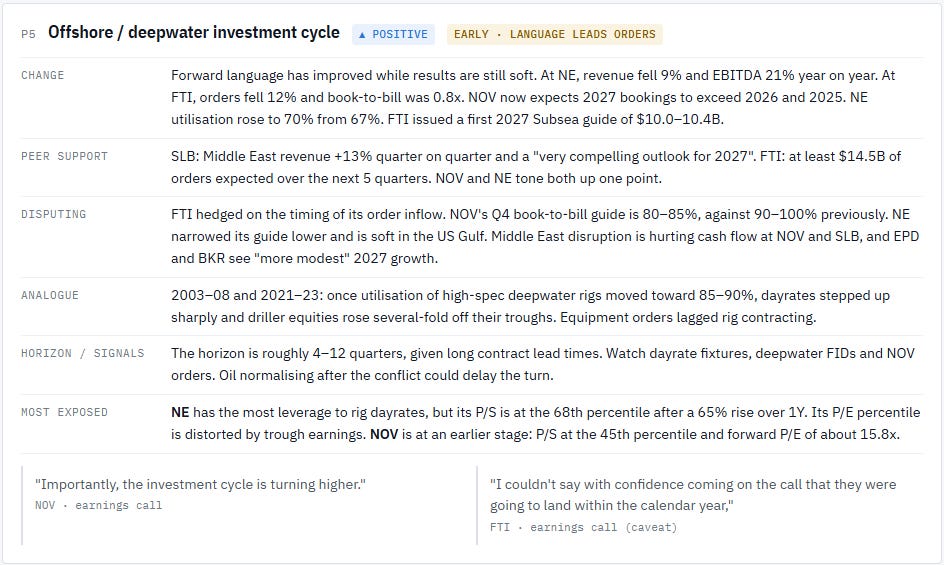
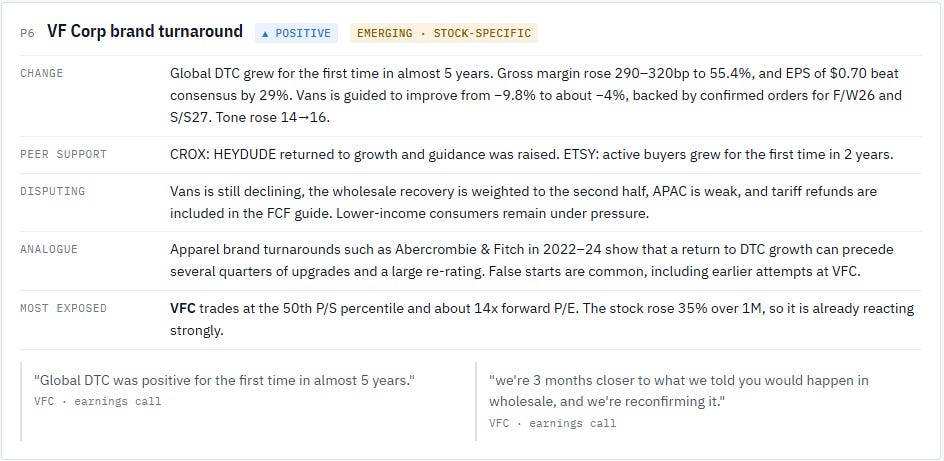
For this exercise, the criteria have been operationalized to reflect fundamental inflection points. The system is looking for contextual signals of changing operating conditions that are emerging after a protracted period of deteriorating conditions (long inflections) or positive operational trends (for short inflections). Importantly, the system is required to verify these signals across more than 1 company. It looks for both corroborating and disputing evidence across related companies to differentiate between the strength of the signal.
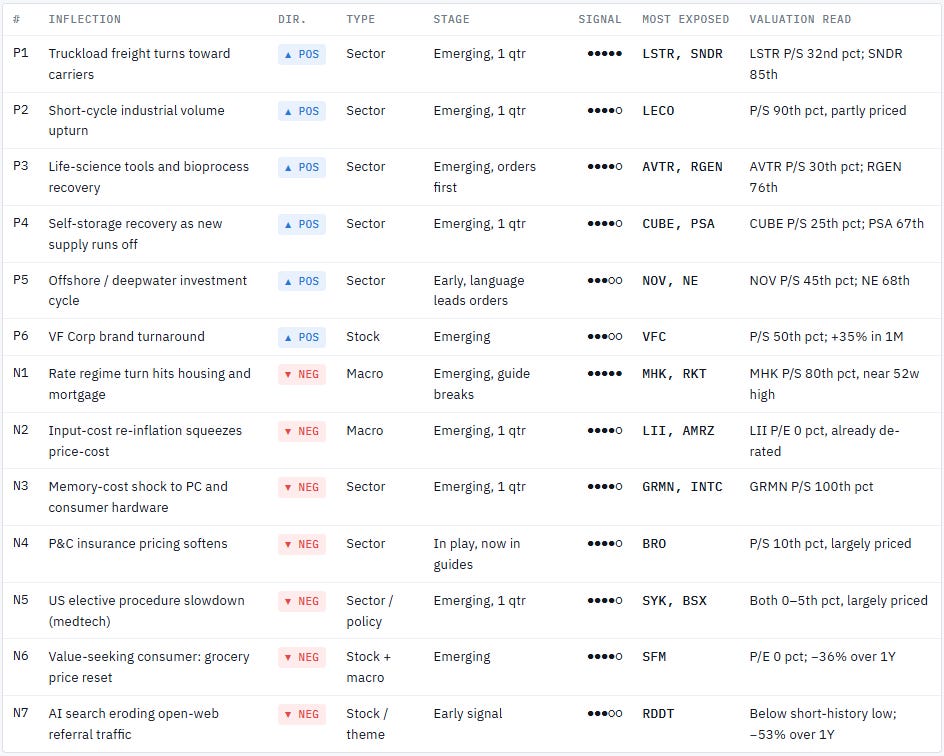
First a summary of potential inflection points identified amongst the 600 result and call summaries processed. You’ll note that the system hasn’t just examined the trading conditions, it has also examined whether the signal is already priced by looking at the multiple percentile within its range and recent share price performance over 1 year and last 1 month.
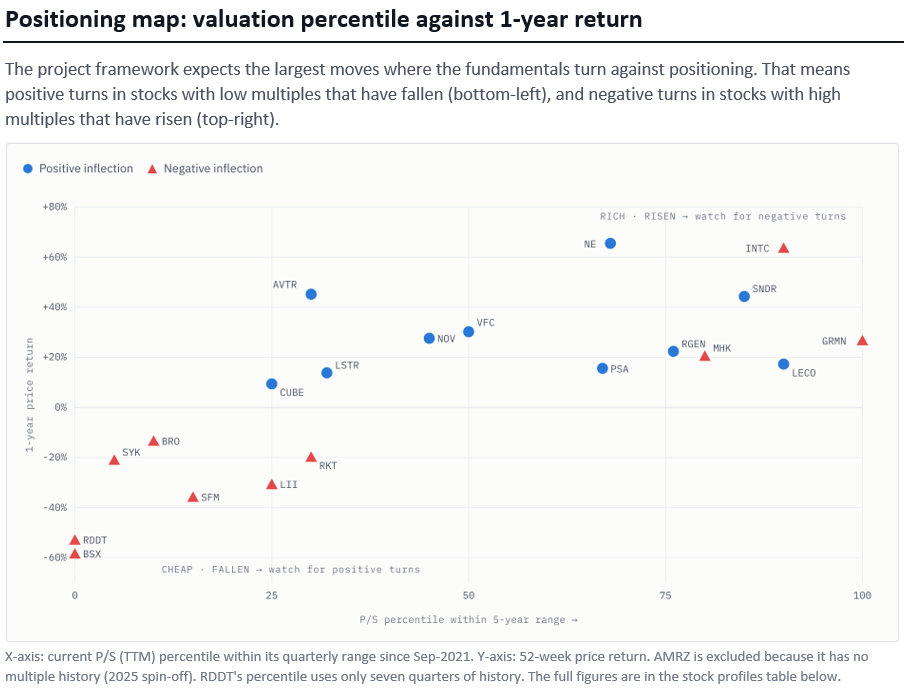
A Positioning map is produced to see where the assessed positive and negative inflection signals map to against valuation and recent returns:
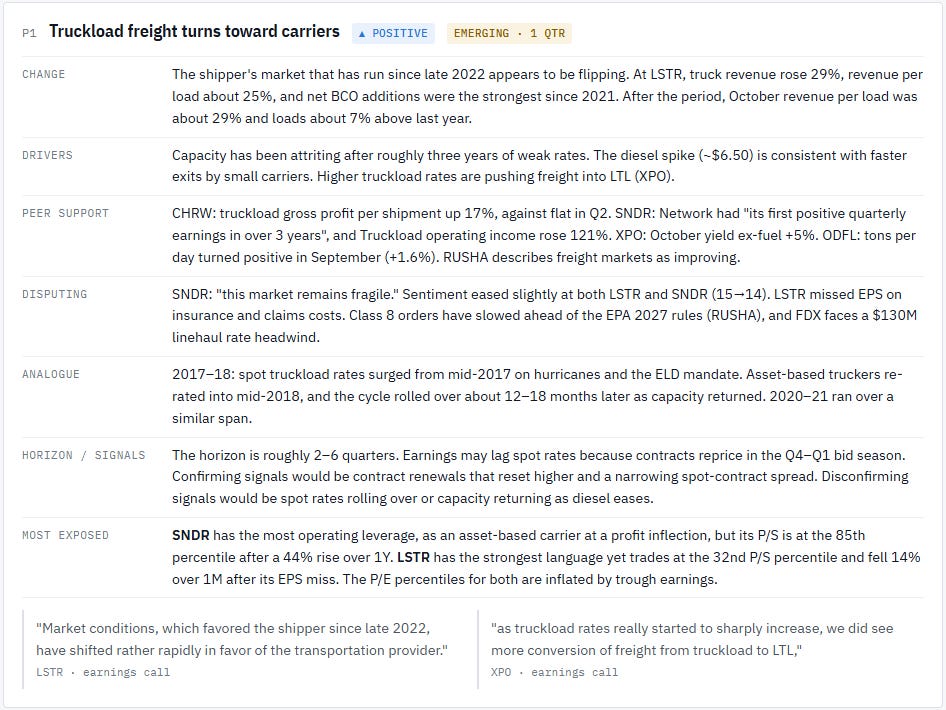
The Most Interesting Potential Positive Inflections:
Truckload Freight; Short Cycle Industrial; Self-Storage; Offshore Rigs; VF Corp Turnaround
The Most Interesting Potential Negative Inflections:
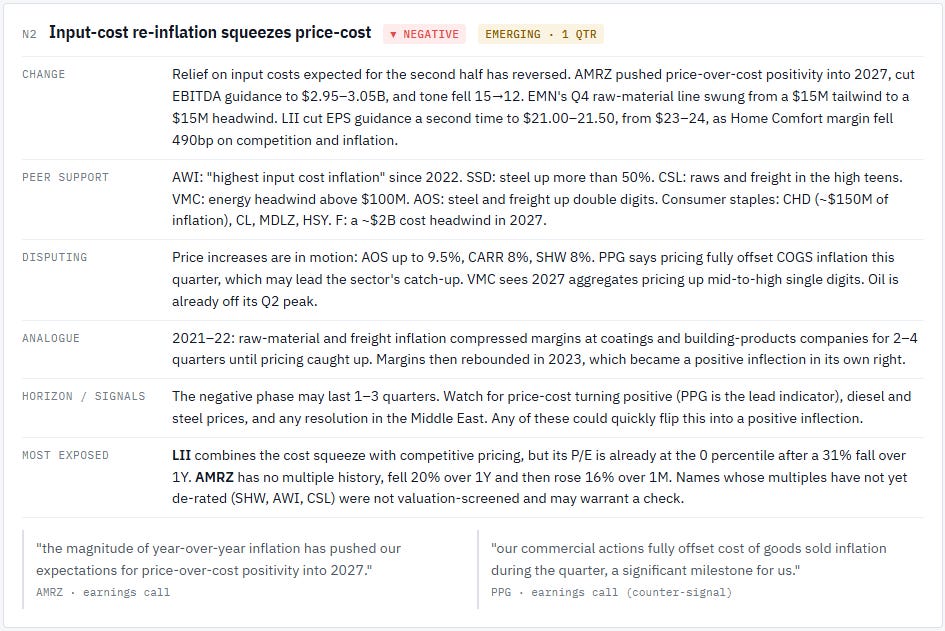
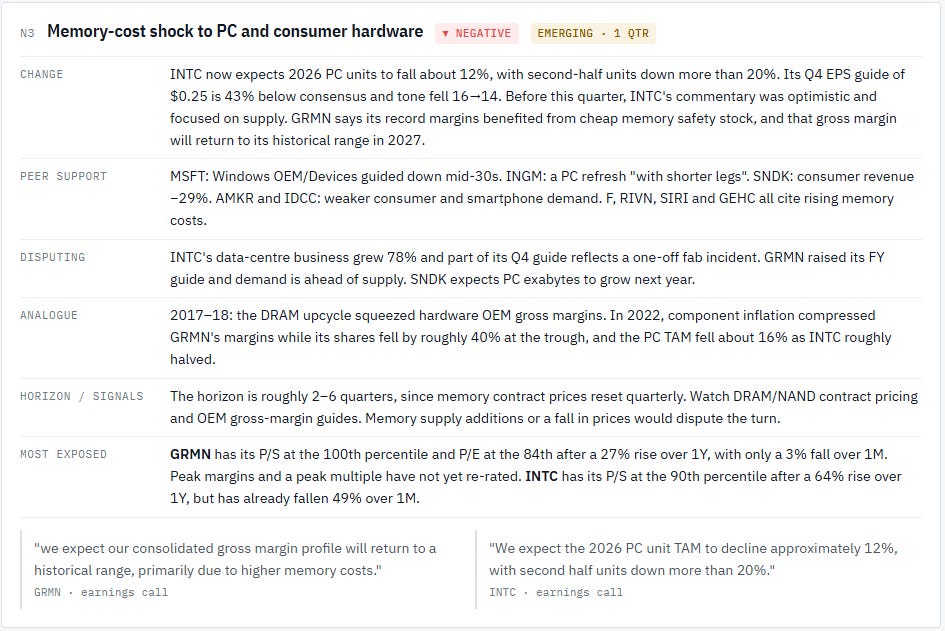
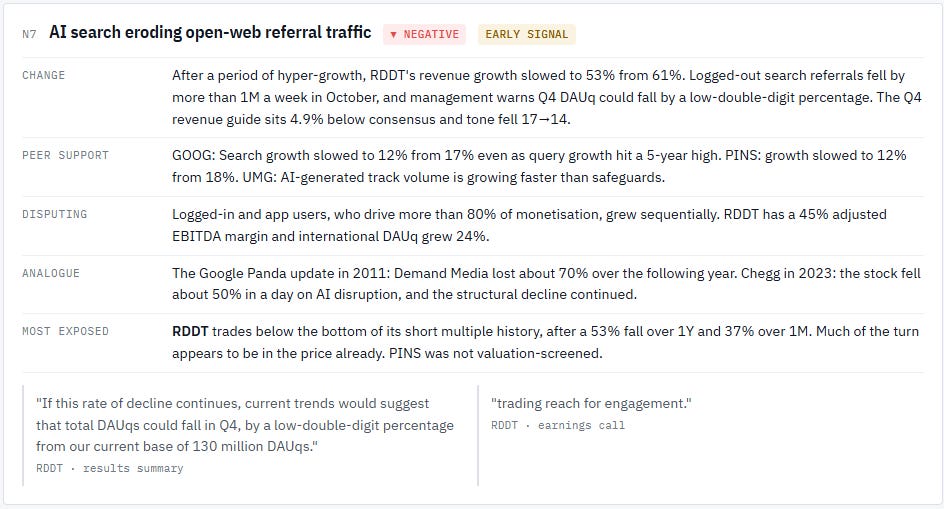
Home Builders and Building Materials; Consumer IT Hardware; Online Portals.
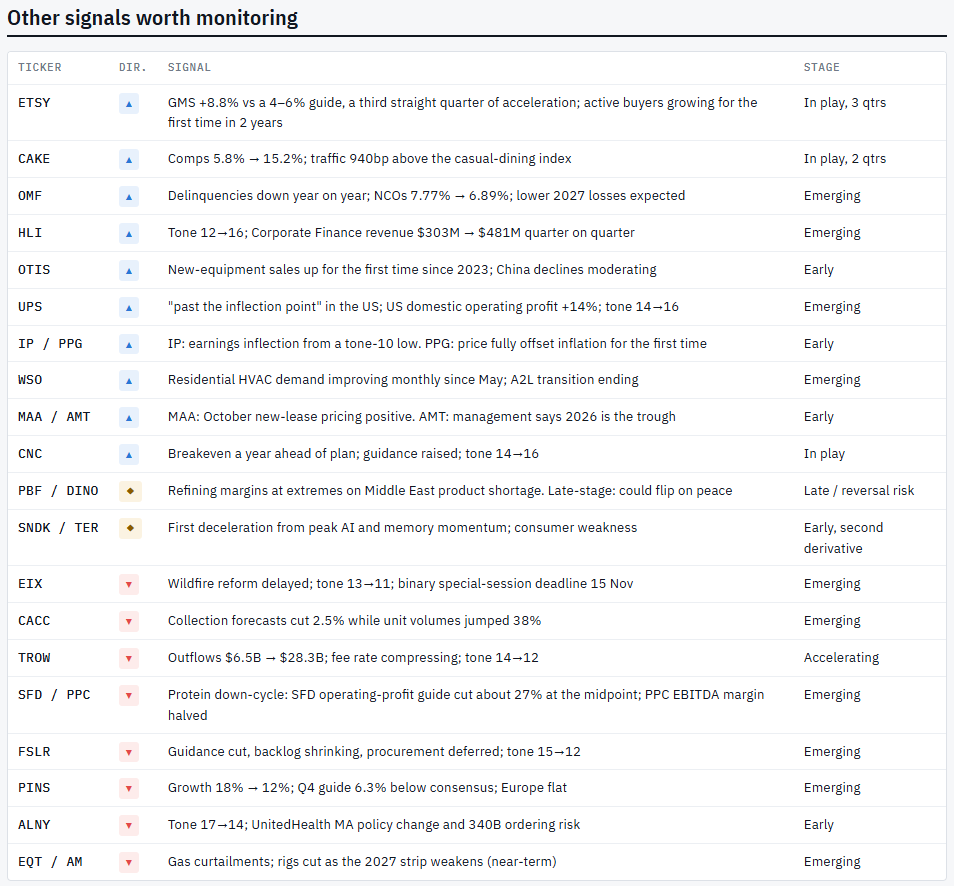
While not meeting the inflection criteria, the scan across results highlighted other signals worth monitoring:
Important Disclaimer: The following stock discussion and analysis is subject to The Inferential Investor’s Disclaimer. This article is for informational and educational purposes only and does not constitute financial product advice or a recommendation to buy or sell any financial product or security. It has been prepared without taking into account any individual’s investment objectives, financial situation, or particular needs. Past performance is not a reliable indicator of future performance. All forward-looking statements are scenario-based assessments and not forecasts or investment recommendations. Recipients should seek independent professional financial advice before making any investment decision. AI can make mistakes and information should be independently verified.
Andy West
Inferent.com & The Inferential Investor
