


The following report was generated with the Equity Risk Regime research workflow from Inferent Analyst, an Agentic Investment Intelligence pltform currently under development. Pre-register here for release later in 2026.

Important Disclaimer: The following stock discussion and analysis is subject to The Inferential Investor’s Disclaimer. This article is for informational and educational purposes only and does not constitute financial product advice or a recommendation to buy or sell any financial product or security. It has been prepared without taking into account any individual’s investment objectives, financial situation, or particular needs. Past performance is not a reliable indicator of future performance. All forward-looking statements are scenario-based assessments and not forecasts or investment recommendations. The economic distance analogs described herein are illustrative historical comparisons and should not be relied upon as predictive indicators. Recipients should seek independent professional financial advice before making any investment decision. AI can make mistakes and should be checked.
Executive Summary
Our new report format is designed for casual readers to be able to quickly absorb the main points in this executive summary and the scenario descriptions. The remainder of the report contains additional detail for those who wish to research deeper into relative asset movements, factors, growth and inflation scenarios and economic distance analogs.
• Regime characterization: The market executed a sharp V-shaped regime reversal in the week ending 22nd May, transitioning from the prior week’s ‘Stagflation Shock / Risk-Off’ regime back toward Risk-On across all four dimensions: risk appetite, growth, inflation, and liquidity. This reversal was compressed into a single week and should be treated as a tentative, rather than confirmed, regime change. News on the weekend regarding progress toward a new US/Iran peace deal, should it ultimately be delivered upon, points towards this transition potentially continuing into next week.
• VIX compressed -9.39% (18.43 → 16.70) — the single clearest barometer of improved risk appetite. VIX is now below its recent peak and approaching the lower end of its 2026 trading range, consistent with complacency risk returning.
• Breadth dramatically improved: RSP (equal-weight S&P 500) outperformed SPY (market-cap-weight) by +162bps (+2.50% vs +0.88%), and IWM (small caps, +2.71%) significantly outperformed QQQ (+1.22%). This is the most important structural signal of the week: the rally has broadened beyond mega-cap AI/tech leadership.
• Oil retreating: USO -4.92% as US-Iran talks signaled progress on Strait of Hormuz reopening. This is the primary catalyst for the regime reversal — a retreat in oil removes the stagflation tail risk that dominated the May 15 report. The 30Y Treasury, which briefly touched a 19-year high of 5.19% on Tuesday, closed the week at approximately 5.04%.
• Disinflation impulse resuming: TLT +1.23% significantly outperformed TIP -0.20% — breakeven inflation expectations fell as oil retreated. Nominal yields partially recovered, erasing some (but not all) of the prior week’s bear-steepener. The 10Y closed ~4.56%, down from its Tuesday spike to 4.67%.
• Gold complex still under pressure: GLD -0.83% (cumulative -3.80% over two weeks) and GDXJ -4.07% (cumulative -11.3% over two weeks). Gold miners underperforming gold suggests real yields remain elevated even as they fall from peaks. No flight-to-safety bid in gold confirms genuine risk-on shift rather than defensive rotation.
• Sovereign downgrade absorbed: Moody’s downgraded the US to Aa1 (from Aaa) at the start of the week, triggering initial equity and Treasury sell-off. Markets subsequently rallied, recovering most losses by Friday — consistent with the historical pattern from S&P (2011) and Fitch (2023) downgrades where initial market disruption was transient.
• Value rotation dominant: VLUE +4.21% was the strongest factor performer, outpacing VUG (growth) by over 400bps. IAT (regional banks) +3.43% and XLU (utilities) +3.40% also outperformed, while VUG (growth) was essentially flat at +0.14%. This signals the market repricing away from pure-growth/duration risk as breakevens moderate and yield levels normalize.
• Q1 2026 earnings season exceptional: 84% beat rate (highest since Q2 2021), 28.4% blended EPS growth, and record 14.8% net margins provide strong fundamental underpinning for equity markets despite macro uncertainty.
• Atlanta Fed Q2 GDP tracking +4.3%: Economy absorbing the oil shock better than feared; consumer spending rose 0.5% in April. However, University of Michigan consumer sentiment remains at all-time lows, reflecting the gap between aggregate data and household inflation experience ($4.55/gallon gasoline).
• Primary economic distance analog — Q3/Q4 1990 (Gulf War Resolution Template): Oil supply shock driven by geopolitical conflict; markets front-running normalization as ceasefire dynamics improve; strong underlying corporate earnings providing a floor; new monetary policy leadership adding uncertainty. From the equivalent phase in March 1991, the S&P 500 rallied approximately 12-15% over the subsequent six months.
• Primary equity implication: Cautiously constructive at the index level noting the rebound already in play. Under the primary scenario of sustained oil retreat and no Fed rate hikes, value, small caps, financials, and AI/semis are the higher probability positioning themes. Key risk: Iran re-escalation or Warsh monetary tightening would reverse this week’s gains.
• Key alternative scenario drivers: Iran talks break down, Strait of Hormuz remains effectively closed, oil re-spikes toward $120+, Warsh signals or delivers rate hike(s), and stagflation regime re-intensifies. Under this scenario, defensives, gold, and duration shorts would outperform.
Four-Dimension Regime Characterization

Equity Market Implications — Primary Scenario Description
The following are scenario descriptions, not forecasts. The primary scenario is defined based on the most recent direction of newsflow but is subject to rapid change as volatile geo-political developments occur. Readers should also refer to the alternative scenario that completes a balanced probability based risk assessment.
Scenario: Iran/Hormuz resolution progress; oil retreats toward $85-95/barrel (Brent); Warsh Fed on hold; disinflation continues; Atlanta Fed Q2 GDP tracking validated near 3.5-4%.
• Index level: Current S&P 500 levels could be well-supported in this scenario, with upside potential (consistent with the 1990-91 and 2023 SVB analog trajectories). The combination of record earnings margins (14.8%), strong EPS growth (28.4%), and declining oil would suggest the elevated forward P/E (~20.9x) is more justifiable than the stagflation scenario would allow.
• Duration assets: If oil continues to retreat and breakeven inflation expectations decline further, TLT may see continued recovery. This would bring the 10Y yield back toward 4.3-4.4% — still elevated historically but meaningfully below the 4.67% spike. Utilities (XLU) and other yield-sensitive sectors could benefit further.
• Value and small caps: The primary scenario is most consistent with continued VLUE and IWM outperformance. The conditions for value outperformance — stable-to-declining rates, strong earnings, wide growth-value premium, domestic growth resilience — all persist. Small caps’ credit sensitivity argues for continued outperformance if regional bank stress does not re-emerge.
• Preferred sectors: Financials (XLF, IAT) if the yield curve improves and credit quality holds; Semiconductors/Tech (SMH, IXN) on the structural AI capex theme; Consumer Discretionary (IYC) if energy prices moderate consumer’s disposable income pressure; Industrials (XLI) as a late-cycle beneficiary of the 4.3% GDP tracking.
• Preferred factors: VLUE (value), QUAL (quality earnings support), MTUM (if momentum continues to build in the right direction). Less conviction on VUG (growth) until yields fall further and the growth-value premium narrows.
• Caution on defensives: Under the primary scenario, XLP, IHF, and defensive positioning may underperform the broad market. However, maintaining some defensive exposure is warranted given the binary nature of the Iran/Hormuz risk that underlies the primary vs alternative scenario distinction.
• Consumer sentiment risk: University of Michigan all-time low sentiment is a genuine medium-term risk even under the primary scenario. If households continue to face $4+ gasoline (plausible even if oil moderates) and if the macro confidence overhang translates to reduced discretionary spending in Q2/Q3, the 4.3% GDP tracking may prove optimistic. This could reduce forward EPS estimates and compress multiples.
• Geopolitical option value: A meaningful acceleration of Iran-Hormuz resolution — reopening the Strait to something approaching normal shipping volumes — could potentially trigger a multi-day oil crash and equity surge, particularly in consumer discretionary, airlines, and rate-sensitive sectors. This is a positive asymmetry in the primary scenario that started to become priced at the tail end of the week.
Balanced Risk Assessment: What Does the Alternative Scenario Look-Like?
Scenario: Iran-Hormuz talks fail; Strait remains effectively closed; oil re-spikes toward $115-125/barrel (Brent); Warsh signals rate hike(s) at June/September FOMC; bear-steepener resumes; stagflation regime intensifies.
• Equity index: Under this scenario, current SPY/QQQ levels could reprice lower by 10%, with the pace of decline driven by oil velocity and Warsh’s tone. The 2022 Ukraine/Russia energy shock analog (secondary analog A) suggests equities could remain under pressure for 3-6 months in a sustained stagflation regime.
• Fixed income: TLT could re-test the 82-83 level (10Y yield approaching 4.8-5.0%), erasing this week’s bond recovery. The 30Y could challenge the 5.2-5.3% level, potentially triggering sovereign bond market stress given the context of the fresh Moody’s downgrade and elevated debt/GDP ratios.
• Preferred defensive positioning: XLP (consumer staples), IHF (healthcare — reversed from this week’s weakness), USMV (min-vol). Energy (IXC) could outperform as oil spikes again (though energy equities may not track oil up as cleanly as they track it down). Gold (GLD) could recover its flight-to-safety bid if the regime shift is dramatic enough — but this requires a re-escalation of the systemic/macro narrative beyond pure oil-shock.
• Factors under alternative scenario: QUAL and USMV (quality and min-vol defensiveness). VUG (growth) likely underperforms sharply as real yields rise further, compressing long-duration equity valuations. VLUE could outperform relative to VUG even in a down market due to its more robust near-term cash flow profile.
• Catalysts that would confirm the alternative scenario: (1) Breakdown in US-Iran negotiations specifically on the Strait of Hormuz toll issue (Iran’s stated condition for reopening); (2) June FOMC meeting where Warsh signals a hawkish pivot (watch Warsh’s first public speech as Chair — critical event); (3) May CPI print (due early June) showing acceleration beyond 4%, driven by energy passthrough; (4) US credit spreads widening materially in response to the Moody’s downgrade or sovereign debt auctions underperforming.
• Key monitoring variables: USO weekly price; 30Y Treasury yield; CME FedWatch June meeting pricing; VIX relative to 18 (a VIX re-break above 18 in the next 1-2 weeks would suggest the alternative scenario gaining probability). Progress on Iran negotiations as reported by news sources.
Andy West
The Inferential Investor

Market Intelligence Report Detail
Newsflow Review across the weeks
Themes Emergent or Intensified in Week Ending May 22
• Moody’s US sovereign downgrade: Moody’s downgraded the US from Aaa to Aa1 at the start of the week, becoming the third major rating agency to strip the US of its top rating (following S&P in 2011 and Fitch in 2023). The 30Y yield spiked to 5.19% and 10Y to 4.67% on Tuesday, but markets recovered as historical precedent suggested limited fundamental impact. By Friday, equities hit all-time highs despite the downgrade.
• AI/semiconductor trade revival: SMH +3.59% this week, reversing the prior week’s -1.80%. Investors ‘re-enchanted with the AI trade’ (per market commentary) as positive Q1 earnings from AI-linked names reasserted the structural capex narrative. This re-engagement supports the thesis that AI was only temporarily sidelined by macro noise rather than fundamentally re-priced.
• Small caps reaching all-time highs: IWM +2.71% and the Russell 2000 reportedly hit all-time highs. This is a significant bullish breadth signal — small cap outperformance suggests confidence in domestic growth resilience and credit stability. RSP +2.50% vs SPY +0.88% represents a dramatic breadth broadening from the prior week’s defensive rotation.
• US-Iran deal progress / oil retreat: The US and Iran signalled progress on a potential agreement that could reopen the Strait of Hormuz. Oil retreated sharply (USO -4.92%) from peak levels. Even if a deal is reached, oil is expected to remain elevated for some time due to infrastructure backlogs and mine-clearing requirements — but the directional signal is one of easing supply-shock risk.
• Atlanta Fed Q2 GDP tracking upgraded to +4.3%: Significantly stronger than feared given the oil shock, and well above the ~2.2% annual consensus. Retail and food services sales rose 0.5% in April (+4.9% YoY). The economy appears to be absorbing the energy shock without entering contraction.
• DOW and S&P 500 hit all-time highs: Despite the Moody’s downgrade, extreme Treasury yield levels, and ongoing Iran conflict, the DJIA and SPY closed at all-time highs on Friday May 22 — a powerful statement of equity market confidence in corporate earnings and eventual oil-shock resolution.
Themes Fading in Week Ending May 22
• Stagflation as dominant market narrative: Last week’s clean stagflation signal (high oil, rising CPI/PPI, bear-steepening curve, rising VIX, cyclical underperformance) significantly moderated this week as oil retreated and the Treasury market partially recovered. Stagflation risk has not disappeared — it remains the key alternative scenario — but it is no longer the marginal driver of market pricing.
• Defensive rotation: The prior week’s defensive-led rotation (IHF +1.88%, XLU leadership, IAT -3.63%, IWM -2.31%) sharply reversed. This week, cyclicals and small caps broadly outperformed defensives. Healthcare (IHF -0.47%) was the only sector in negative territory.
• Rate-hike urgency in the near term: While rate-hike risk is non-zero (and remains in the alternative scenario), the market’s immediate pricing of imminent hikes appears to have softened slightly as oil retreated and breakeven inflation expectations fell. This has provided some relief to duration-sensitive assets.
Cross-Asset Signals
Macro-Sensitive Asset Movements
• Oil (USO -4.92%): After last week’s +10.96% supply-shock surge, oil retreated sharply as Iran deal optimism grew. The magnitude of the move (+10.96% then -4.92% over two weeks) reflects a geopolitically-driven supply shock where market participants are actively pricing the probability of Hormuz reopening. Energy equities (IXC +0.14%) barely moved, suggesting the equity market is forward-looking — holding energy companies’ valuations even as spot oil retreats.
• Gold (GLD -0.83%, GDXJ -4.07%): Gold is in a persistent two-week decline (-4.61% cumulative). GDXJ has collapsed -11.3% over two weeks. The absence of a flight-to-safety bid in gold — despite the Moody’s downgrade and ongoing Iran conflict — confirms genuine risk appetite improvement rather than defensive rotation. The continued underperformance of miners versus bullion reflects elevated real yields (higher real rates compress gold miner valuations through the discount rate mechanism).
• Copper (CPER +2.07%, COPX +0.37%): Copper recovering after last week’s weakness is a positive growth signal. The commodity ETF outperforming miners suggests a physical demand bid rather than pure speculative positioning. Copper is the ‘economist’s metal’ — its recovery is consistent with the market upgrading the growth outlook (4.3% Q2 GDP tracking).
• Treasuries (TLT +1.23% vs TIP -0.20%): Long bonds rallied (yields fell) while TIPS were marginally negative. This means nominal yields fell more than real yields — implying breakeven inflation expectations DECLINED (i.e., less inflation priced in). The disinflation interpretation is consistent with oil retreating. However, yields remain historically elevated (10Y ~4.56%, 30Y ~5.04%), meaning the regime has not fully normalised.
• DXY: DXY unavailable from Finnhub. UUP proxy +0.04% this week vs +1.57% prior week — dollar essentially flat. This stabilisation after the prior week’s dollar strengthening is consistent with the risk-on backdrop. A stable-to-weakening dollar in a risk-on environment supports international equities and commodities. If the Hormuz crisis resolves and oil falls further, the dollar could resume modest weakening.
Risk Barometers Summary
• VIX: 16.70 (down from 18.43, -9.39%). Crossed back below the 18 ‘moderate anxiety’ threshold. However, at 16.70, VIX is not deeply low by historical standards — it is consistent with ‘cautious optimism’ rather than outright complacency. A level below 15 would signal genuine market confidence.
• Flight-to-safety absent: Gold falling, TLT rallying on lower yields (not a crisis bid), dollar flat — the signature of genuine risk appetite improvement rather than flight to safety.
• Breadth improvement: RSP outperforming SPY, IWM outperforming QQQ — both are confirmatory signals of a healthy, broad-based rally rather than concentrated mega-cap performance masking underlying weakness.
Inflation vs Growth Dynamics
Inflation Expectations: Disinflation Impulse Resuming
• TIP vs TLT divergence: TLT +1.23% vs TIP -0.20% = TLT outperformed TIPS by 143bps. In a bond rally where TIPS underperform nominal bonds, it means investors are pricing less future inflation (breakevens are falling). Put plainly: the market is saying that, with oil retreating, the inflation premium built into yields over the past two weeks is being partially unwound.
• Gold decline as disinflationary signal: GLD -0.83% (continuing the prior week’s -3.80% move). Gold typically rallies in stagflationary environments as an inflation hedge and store of value. Sustained gold decline while risk assets rally = disinflationary growth scenario being priced, not stagflation.
• Oil retreat is the linchpin: USO -4.92% removes the primary marginal inflation driver from the past two weeks. With $4.55/gallon gasoline already embedded in consumer budgets, any sustained oil decline would reduce forward CPI expectations materially — particularly given the roughly 3-month transmission lag from oil prices to CPI prints.
• Caveat — yields remain elevated: Despite this week’s rally, the 10Y at ~4.56% and 30Y at ~5.04% remain well above the 4.1-4.3% range seen before the Iran conflict escalation. The market has not fully priced out the inflation risk — it has simply reduced the marginal addition from oil. A re-escalation of the Hormuz crisis would quickly reverse this week’s bond rally.
Growth Expectations: Repricing Upward
• Atlanta Fed Q2 GDP at 4.3%: This is a significant upward revision and well above consensus. It suggests the US economy is absorbing the energy price shock through the income-side (energy sector profits are up) and through the lagged effects of strong Q1 corporate earnings rather than entering stagflationary contraction.
• Small cap outperformance (IWM +2.71%): Small caps are typically more domestically-oriented and more sensitive to domestic credit conditions. Their outperformance signals confidence in domestic growth durability. Small caps also have higher financial leverage, making their rally a vote of confidence in credit stability — consistent with IAT (regional banks) +3.43%.
• Cyclical vs. defensive rotation: Cyclicals broadly outperformed defensives this week. SMH +3.59%, IAT +3.43%, IXN +2.47%, IYC +1.89% vs XLP +0.20%, IHF -0.47%. The only defensive outperformer was XLU +3.40%, which is plausibly yield-driven (TLT rallied) rather than a defensive bid.
• Copper recovery (CPER +2.07%): After two weeks of pressure, copper’s recovery adds to the growth-positive narrative. Copper is widely used in construction, manufacturing, and the energy transition — its price is a forward-looking growth indicator. The recovery suggests China and global growth expectations are stabilising.
• Consumer sentiment divergence: University of Michigan sentiment at all-time lows persists as a counterpoint to the strong aggregate data. Consumer confidence is a leading indicator that can presage demand weakness 3-6 months out if it remains depressed. This divergence between aggregate data strength and household sentiment is a key tail risk for the growth-positive narrative.
Stability of Views
• Volatile, not trending: The cross-asset signals have been sharply volatile week-to-week: May 8 (risk-on concentrated) → May 15 (stagflation shock) → May 22 (risk-on broadening). This three-week oscillation pattern is not consistent with a settled regime. The speed of the reversal suggests that Iran/Hormuz developments are the primary exogenous variable, with the market’s underlying regime being closer to neutral/fragile than to a firmly established bull or bear trend.
Paired Security Signals
The following pairs examine relative price movements to isolate specific risk appetite dimensions:
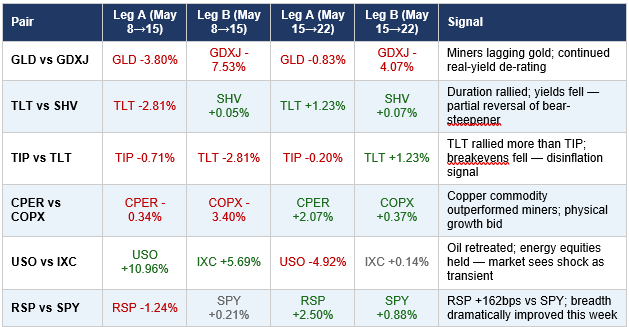
Most Telling Divergences This Week
• TIP vs TLT (most telling): TLT +1.23% vs TIP -0.20% — the 143bps divergence in favour of nominal bonds is the clearest signal that inflation expectations moderated this week. This is consistent with oil retreating and provides the disinflationary counterpart to last week’s inflation shock. In plain terms: the bond market is saying ‘we believe oil will fall and inflation will moderate.’ Investors should however note the volatility in this view week to week as it has been a see-saw, as geo-political developments continually reverse direction.
• RSP vs SPY (most constructive): RSP outperforming SPY by 162bps (+2.50% vs +0.88%) is the most bullish structural signal of the week. Equal-weight outperformance means the average stock is outperforming the mega-cap-weighted index — a hallmark of healthy, sustainable bull markets. This contrasts sharply with the narrow, concentrated leadership of May 8 (QQQ +5.48% with IWM lagging) and May 15 (defensives only).
• USO vs IXC (most informative of market expectations): Oil (USO) fell -4.92% while energy equities (IXC) barely moved (+0.14%). The expanding premium of energy equity prices over spot oil prices implies the equity market is pricing either: (a) a sustained business value for energy companies even at lower spot oil, or (b) an expectation that the current oil decline is temporary and spot prices will recover. Given the Hormuz context, interpretation (a) is more likely — the market is forward-looking on energy companies’ earnings power.
• GLD vs GDXJ (most cautionary): GDXJ’s continued underperformance of GLD (-4.07% vs -0.83%) with the two-week cumulative reaching -11.3% vs -4.61% suggests that real yields, while falling from their spikes, remain at levels that de-rate leveraged gold exposures. This tells us the bond market’s partial recovery this week has not yet been sufficient to materially ease real rate pressure on the gold complex.
Sector Rotation & Factor Signals
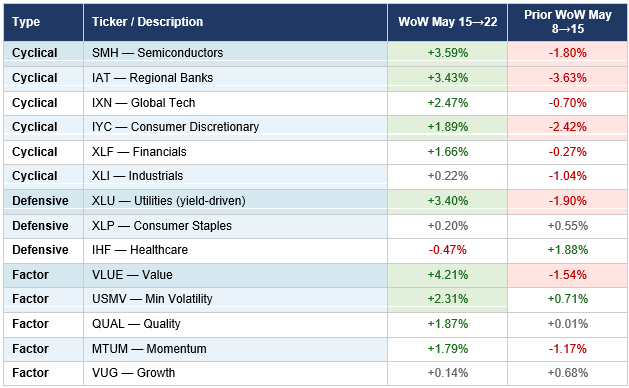
Key Rotation Insights
• The value factor reversal: VLUE +4.21% was the top performer across all factors. This is a significant rotation signal. In the prior week, VLUE fell -1.54% as stagflation fears drove uncertainty across all cyclical exposures. This week’s sharp value revival — at a time when breakeven inflation expectations are falling and growth data is strong — is consistent with the ‘disinflationary growth’ regime that value stocks historically outperform in. Value traditionally outperforms when: (a) interest rates are elevated but stabilizing, (b) earnings are strong, (c) the growth-vs-value P/E premium is wide. All three conditions currently hold.
• Value vs Growth leadership: VLUE +4.21% vs VUG +0.14% = over 400bps divergence in a single week. Growth (VUG) being essentially flat despite the broad market rally is unusual — it may reflect ongoing duration-sensitivity of long-growth assets given the still-elevated yield environment. The market is willing to buy the rally but is preferring stocks with near-term cash flows over long-duration growth premiums.
• AI/Semiconductor re-engagement: SMH +3.59% after last week’s -1.80% signals that the AI capex structural theme has reasserted itself over the near-term macro noise. Large-cap AI-linked names reported strong Q1 results, reinforcing the narrative that AI-related capital spending is structural (and in many cases already contracted) rather than cyclically sensitive. This supports the AI theme as a durable rather than transient bull market driver.
• Regional bank recovery (IAT +3.43%): Regional banks were the hardest-hit cyclical last week (-3.63%) and have recovered strongly. The reversal suggests the credit quality concerns from last week’s stagflation narrative have moderated — consistent with the disinflation impulse. Regional banks benefit from a steepening yield curve; if TLT continues to rally (yields fall at the long end while short rates remain anchored), net interest margins could widen favourably.
• Utilities (XLU +3.40%) — yield-driven rather than defensive: Utilities outperformed despite a risk-on week, which seems paradoxical. The explanation is likely mechanical: utilities are highly rate-sensitive assets (their dividend yield is compared against bond yields). As TLT rallied and long yields fell, utilities became relatively more attractive versus bonds — driving their outperformance. This is not a defensive bid; it is a yield-curve-driven revaluation.
• Healthcare (IHF -0.47%) — the odd one out: Healthcare was the only sector to decline, despite the defensive-to-cyclical rotation narrative suggesting defensives should hold their own. IHF’s weakness may reflect sector-specific headwinds (policy/regulatory risk, valuation compression after last week’s +1.88% defensive bid that is now unwinding).
Economic Distance Analogs (Comparable Historical Periods)
Economic distance analogs compare the current configuration of growth trajectory, inflation dynamics, and key macro drivers to historical periods to inform expectations about the likely equity market trajectory over the next 3-6 months. Analog selection is explicitly probabilistic and scenario-based, not deterministic or a forecast.
PRIMARY ANALOG: Q3/Q4 1990 — Gulf War Energy Shock and Resolution (Confidence: Moderate-High)
• Historical period: August 1990 (Iraq invades Kuwait) through March 1991 (Desert Storm victory, oil collapses from $40+ to $20 within weeks of ceasefire).
• Key similarities: (1) A geopolitically-driven oil supply shock causing sudden inflation repricing; (2) strong underlying corporate earnings providing an equity floor despite macro uncertainty; (3) markets pricing the resolution of the conflict before it formally occurred; (4) new Federal Reserve leadership adding monetary policy uncertainty (Alan Greenspan had taken over from Paul Volcker in 1987 and was navigating his first oil-shock crisis); (5) wide divergence between consumer sentiment (pessimistic) and aggregate economic data (resilient).
• Key differences: (1) The 1990-91 US economy did enter recession — current data (4.3% Q2 GDP) suggests no recession; (2) the 1990 oil shock was shorter (~6 months) whereas the 2026 Hormuz crisis has persisted for nearly 3 months with uncertain resolution timeline; (3) current equity valuations are elevated (forward P/E ~20.9x) vs more modest valuations in 1990; (4) the US is now a net energy producer, moderating the domestic economic impact of oil price spikes.
• Current market phase within analog: We appear to be at the equivalent of late January to early February 1991 — the period when Coalition air campaigns were clearly succeeding and oil prices began their sharp decline from the peak, but formal ceasefire had not yet been declared. At this phase in 1991, the S&P 500 had already begun its sustained rally.
• Historical equity performance from this phase: From late January 1991 through August 1991 (approximately 6 months), the S&P 500 rallied approximately 15-20%, with cyclicals and technology-adjacent names leading. Value stocks outperformed growth in the early phase as interest rates came down and financial sector credit concerns eased. Small caps initially lagged but eventually caught up. The rally was not linear — there was a period of consolidation after the initial surge.
• What would invalidate this analog: (1) Iran conflict re-escalation — oil spikes to $120+ and Hormuz remains closed for another 3-6 months; (2) Warsh delivers a rate hike, shifting the monetary policy backdrop from 1991’s rate-cutting environment to an actively tightening one; (3) Q2 GDP tracking 4.3% proves to be a weather/one-off effect and Q2 actual growth prints materially lower.
SECONDARY ANALOG A: H1 2022 — Russia/Ukraine Energy Shock (Hawkish Policy Risk Scenario)
• Historical period: February-June 2022. Russia invaded Ukraine, oil spiked toward $130/barrel (Brent), inflation hit multi-decade highs, and the Fed entered an aggressive hiking cycle.
• Key similarities: (1) Geopolitical energy supply shock with uncertain resolution timeline; (2) central bank in transition (Powell pivoting from ‘transitory’ to aggressive hiking — analogous to Warsh navigating from cut-expectations to potential hikes); (3) high energy costs creating consumer spending pressure; (4) strong labour market with elevated wages.
• Key differences: (1) In 2022, the Fed was actively hiking from near-zero — in 2026, Warsh would be hiking from an already-elevated 3.5-3.75% base, a much more contractionary starting point; (2) 2022 had broad inflation (housing, services) whereas 2026 inflation appears more oil-shock-concentrated; (3) Q1 2026 EPS growth of 28.4% is vastly stronger than 2022’s deteriorating earnings trend.
• Current market phase: Under this analog, we would be in approximately March 2022 — the period of initial oil spike where markets were hoping for a quick resolution that did not materialise. If Hormuz negotiations fail, the 2022 path suggests further equity downside of 15-25% from current levels, with value and energy outperforming growth.
• Probability: 25-30%. This is the key alternative scenario and represents the primary downside risk to the primary analog.
SECONDARY ANALOG B: Q1-Q2 2023 — SVB Crisis Recovery and Breadth Restoration
• Historical period: March-June 2023. The SVB/Signature Bank failure in March 2023 triggered a sharp but brief risk-off episode, before markets recovered strongly as the crisis proved contained and the AI/tech narrative took hold.
• Key similarities: (1) A sharp risk-off episode (comparable to May 15’s stagflation shock) proving to be transient; (2) rapid VIX compression from spike levels; (3) small cap and equal-weight outperformance following an initial period of narrow mega-cap leadership; (4) value and quality factors outperforming in the recovery phase; (5) AI/semiconductor theme serving as a structural bid underneath the market throughout the uncertainty.
• Key differences: (1) SVB crisis was a domestic credit event, not an energy supply shock — fundamentally different inflation dynamics; (2) Fed was actively hiking in 2023, whereas Warsh is currently on hold; (3) geopolitical risk was not a central concern in 2023 whereas Hormuz risk is an ongoing exogenous variable.
• Performance from this phase: From post-SVB trough (March 2023) through August 2023, S&P 500 rallied approximately 18-22%, with AI/tech and small caps leading in the later phase. Quality and momentum factors performed well; pure defensives lagged.
Analog Synthesis
• Primary scenario path: The 1990-91 Gulf War Resolution template (primary analog) suggests a constructive 3-6 month equity outlook provided oil continues to retreat and the Warsh Fed remains on hold. The parallel with the SVB recovery (secondary analog B) reinforces this — both episodes featured a sharp risk-off that proved transient, followed by breadth broadening and value/small cap leadership in the recovery.
• Break conditions: If Iran-Hormuz conditions deteriorate, the 2022 Ukraine energy shock analog (secondary analog A) becomes dominant, implying material equity downside and a prolonged stagflation regime.
Regime Context — Comparison to Prior Weeks
Three-Week Regime Arc (May 8 → May 15 → May 22):
• Week ending May 8 — Risk-On (Concentrated / AI-Led): QQQ +5.48%, IWM +1.74%, SPY +2.35%. Narrow AI/tech leadership following US-China tariff ceasefire. Goldilocks-with-tail-risk characterization. Disinflation impulse dominant. Gold elevated (debasement bid, not flight-to-safety).
• Week ending May 15 — Stagflation Shock: DXY +1.46%, TLT -2.81%, GLD -3.80%, USO +10.96%, VIX +7.21%. CPI 3.8% YoY (highest since May 2023), PPI +1.4% MoM. Warsh sworn in. Clean stagflation cross-asset signature. Cyclicals decimated, defensives bid. Rate-hike probability surged.
• Week ending May 22 — Risk-On Reversal (Broad / Value-Led): VIX -9.39%, RSP +2.50%, IWM +2.71%, VLUE +4.21%, TLT +1.23%, USO -4.92%. Oil retreats on Iran deal optimism. Moody’s downgrade absorbed. Markets hit all-time highs. Disinflationary growth scenario re-pricing. V-shaped reversal from prior week’s stagflation regime.
Multi-Week Trend Assessment
• Gold: Persistently declining over three weeks (433.77 → 417.29 → 413.83, cumulative -4.6%). The trajectory suggests a systematic de-rating of the gold complex as the initial macro tail-risk premium is unwound. This is not yet at a level suggesting the risk-off premium is fully removed, but the direction is clear.
• GDXJ: Sharper three-week decline (125.84 → 116.37 → 111.63, cumulative -11.3%). Miners’ accelerating underperformance vs gold confirms sustained real-yield pressure. This is a regime-level signal — real yields are structurally higher in 2026 relative to 2023-2024.
• VIX: Spike-and-reversion cycle completed in two weeks (17.19 → 18.43 → 16.70). The speed of the VIX reversal is notable — it suggests investors are treating the stagflation shock as an episodic event rather than a regime shift. This increases the risk of complacency if conditions deteriorate again.
• USO: Explosive shock and partial mean-reversion (133.59 → 148.23 → 140.93). Still elevated vs May 8 levels (+5.5%). The net two-week change confirms that while oil has retreated from its peak, the geopolitical premium has not been fully eliminated. Oil remaining above $110 Brent would be consistent with 140.93 on USO.
• Regime persistence: The three-week oscillation between risk-on, stagflation shock, and risk-on recovery does not constitute a settled regime. The market is in a transitional state, highly dependent on Iran/Hormuz developments and the Warsh Fed’s communication. Each week’s regime assessment should be held with wider-than-usual uncertainty bands.
Andy West
The Inferential Investor
