Inferent Signals - 11 May 2026
Ahead of the trading week, recap on what the market internals are telling us...

Important Disclaimer: The following discussion and analysis is subject to The Inferential Investor’s Disclaimer. It is provided for informational purposes only, does not constitute investment advice or a solicitation, and is not a recommendation to buy or sell any security. Any forward-looking statements reflect scenarios, distinct from actual forecasts, that will change with evolving information and data and are inherently risky and uncertain. Past performance is not indicative of future results. AI assisted analysis can make mistakes and should be verified.
In case you missed it, I published this week’s Market Intelligence Report early on Saturday. There’s some very interesting signals in this week’s report that I’ve explored further through a discussion below…
The market moved into pricing a forward “goldilocks” disinflation view with crude pulling back, equities strong, particularly long duration, the 10 year yield retracing and historically strong momentum factor performance.
Economic Distance Analogs show some comparison to other post Middle East conflict and oil price shock scenarios which previously have shown consistent post conflict equity market strength.
Whilst this set up is broadly positive and has been consistent with continued positive equity market and tech performance in past scenarios, it also shows some vulnerability.
Crude stockpile drawdowns continue and without a SoH reopening, can result in further periods of crude price spikes. Such episodes will challenge equities as they pressure the rate path and economic growth outlook.
While the equity market rally accelerated last week, breadth actually reduced through it. It has become increasingly large cap and AI concentrated and defensives and value remain strongly bid with quality factor performance deteriorating on a relative basis suggesting the rally is becoming stretched and moving out the risk curve.

Charts and Factors to Consider following last week’s moves:
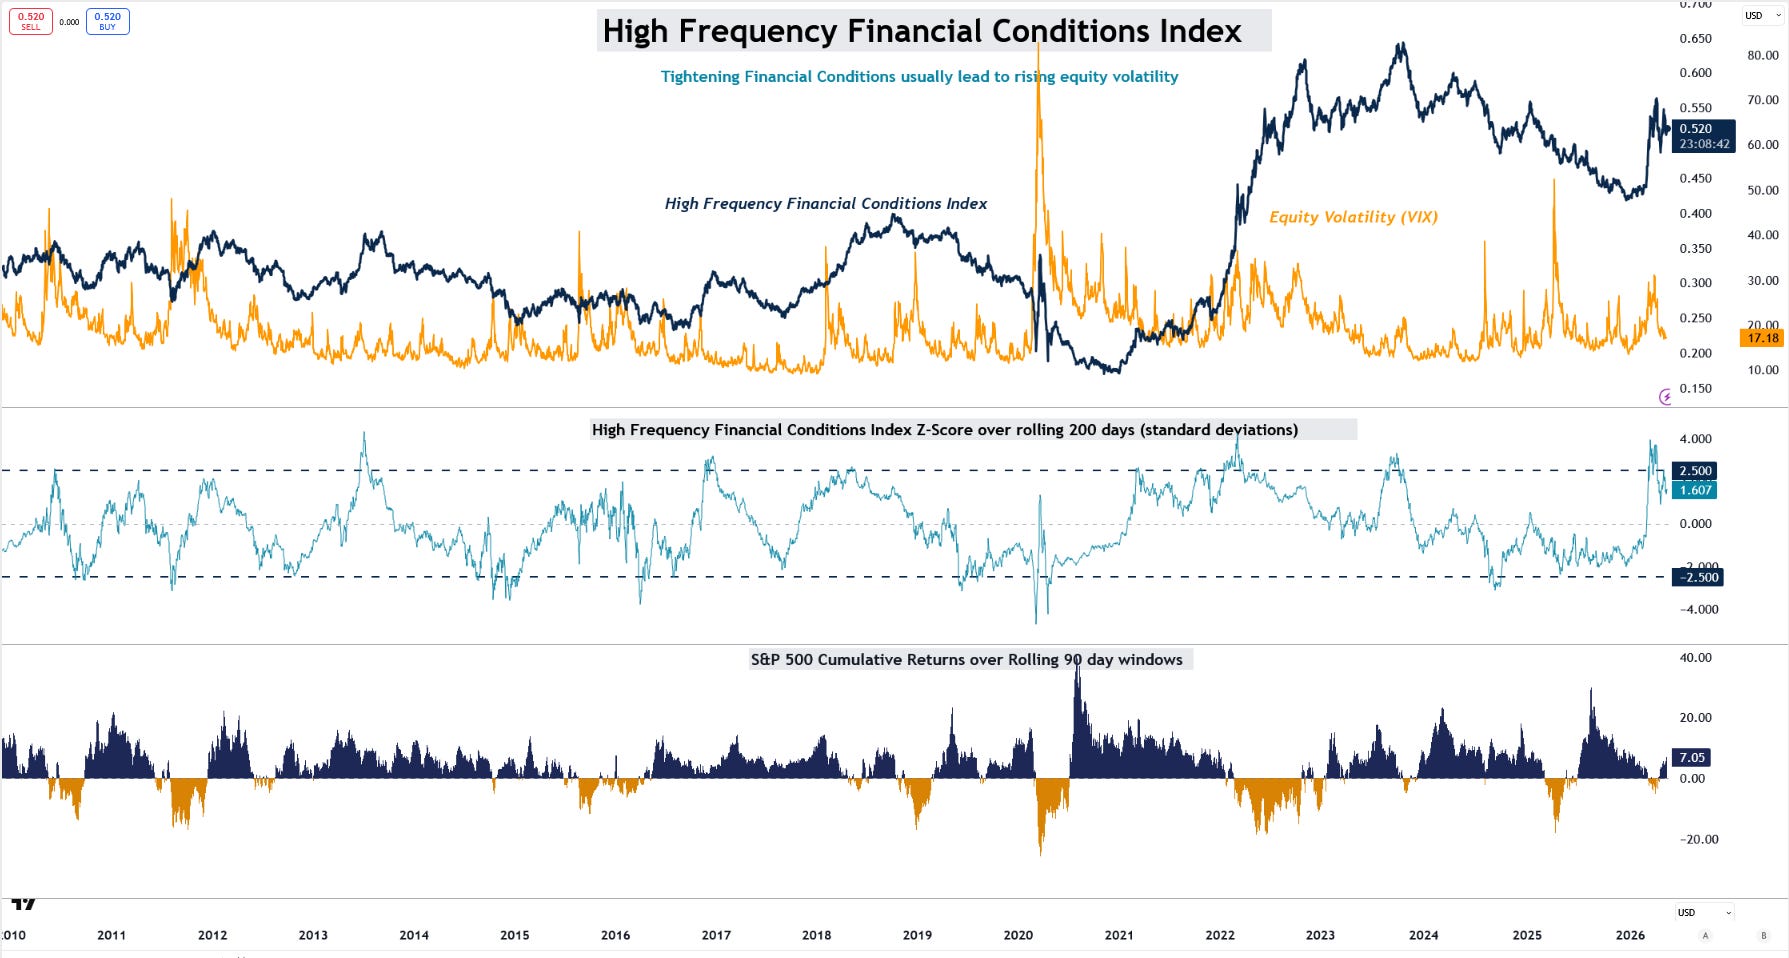
1. The Rally is fueled by loosening financial conditions
High Frequency financial conditions peaked on Tuesday 7th April and have since declined (loosened). The Nasdaq 100 has surged 11% since that time. This loosening is build on a belief that the ceasefire (announced that same day) will hold and eventually allow the Straight of Hormuz to be reopened and crude oil prices and inflation to normalize.
This is a belief that may be tested. We have seen additional oil spike to higher prices (eg late April) since that time, but the market has looked through. Crude stockpile drawdowns are continuing that creates tension in oil prices under the surface, making further spikes a real risk. Large spikes (such as if US boots hit the ground) can quickly reverse the rally.
2. Momentum is Very Stretched:
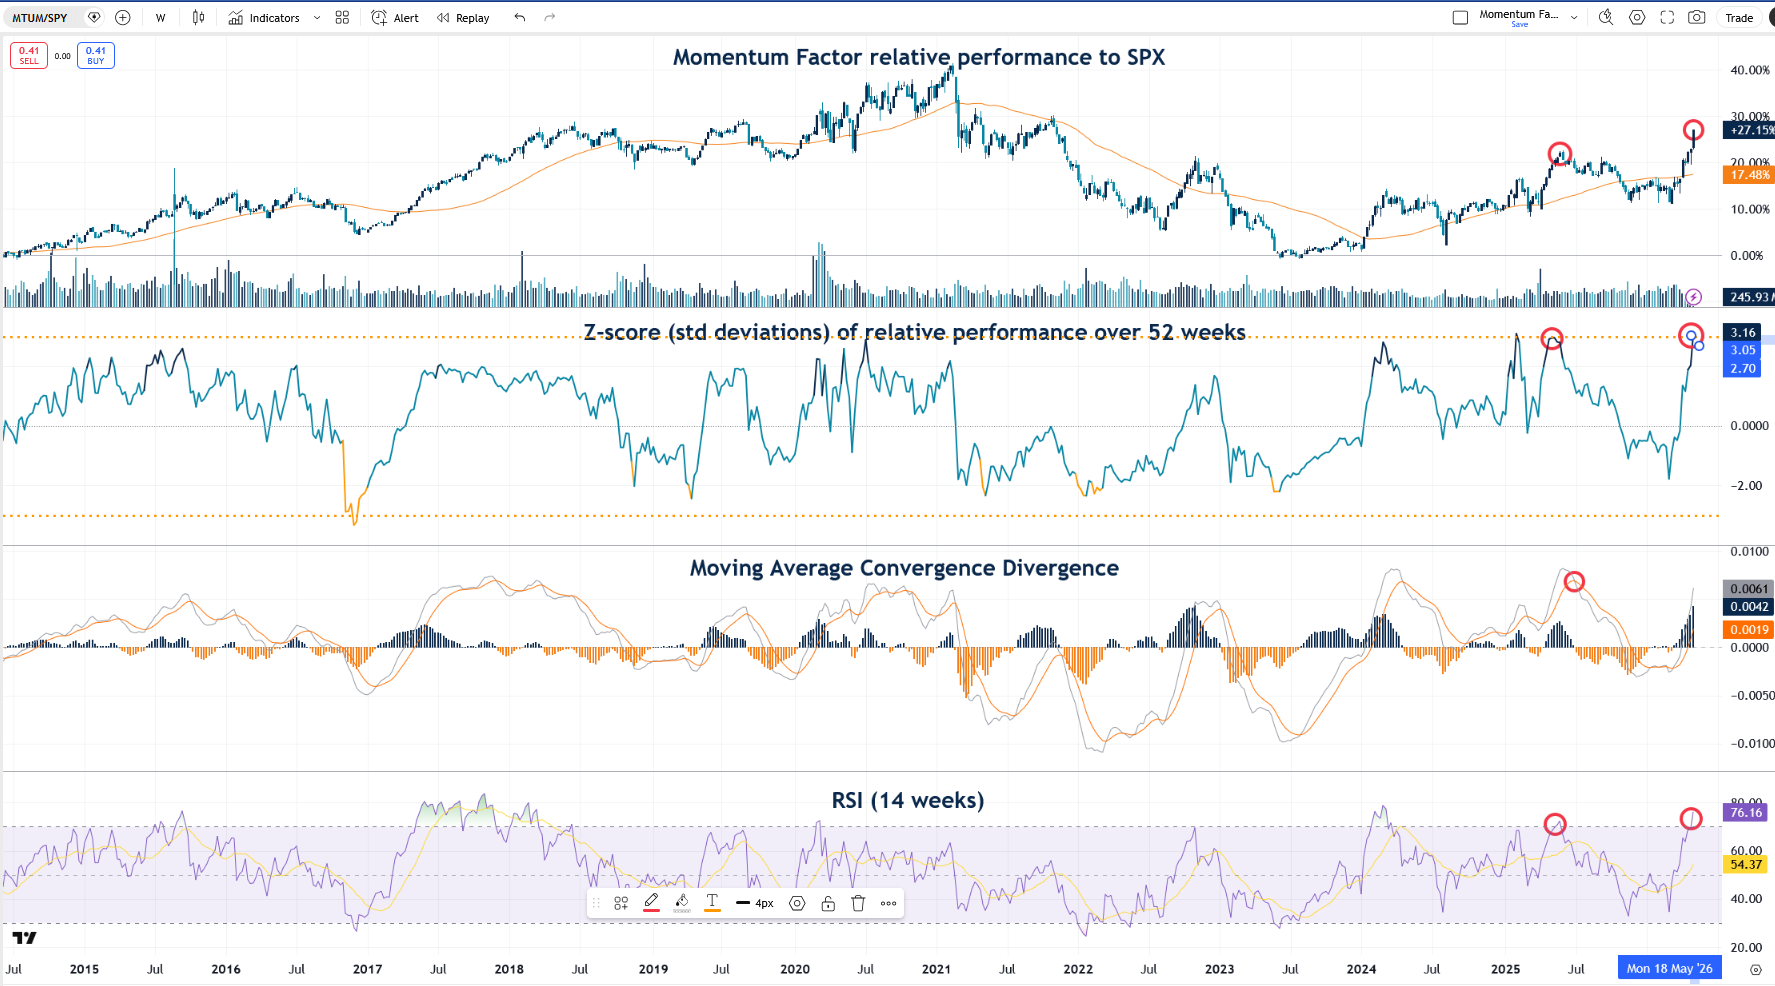
Previous episodes that have followed a momentum spike like this have resulted in a Momentum retracement. Investor portfolios are crowded into momentum driven / AI exposed names. Momentum factor hedging appears worthy of consideration at these levels. Low quality AI single stock shorts could become a portfolio’s best friend.
3. Breadth is positive but deteriorating
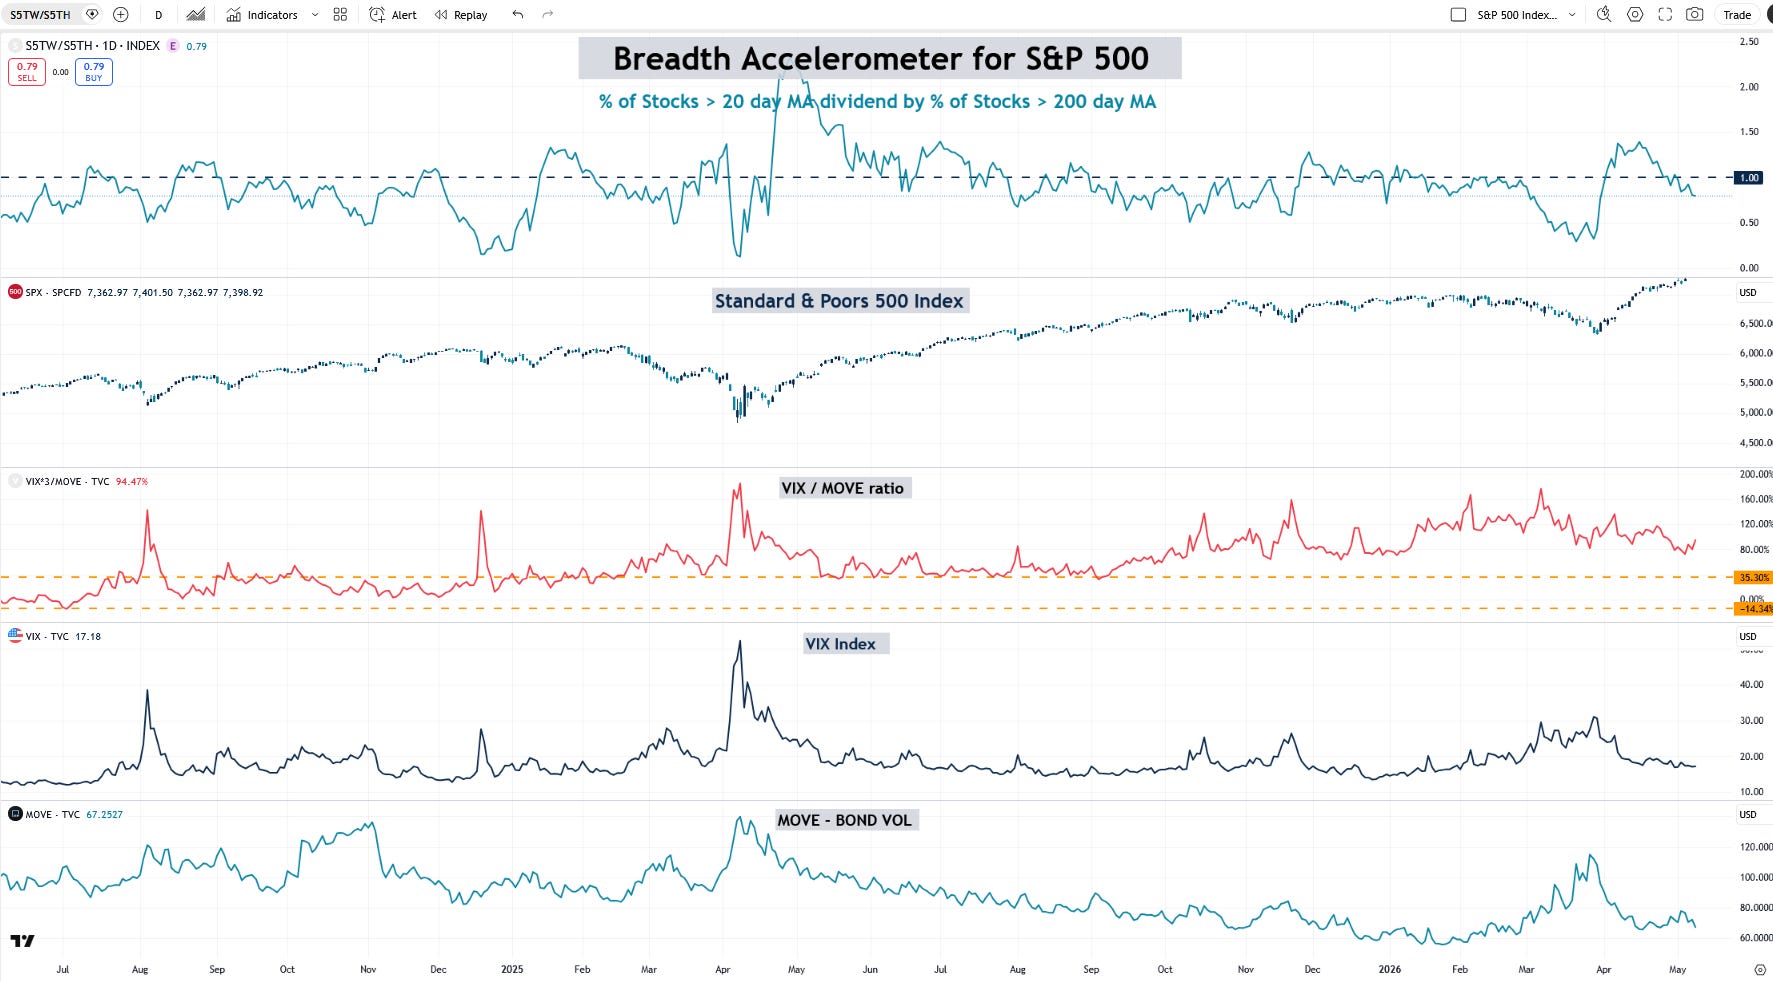
S&P 500 Breadth peaked on the 16th of April and is falling. The rally is built now on a much narrower base with last week’s surge driven by the mega-cap tech names due to a concentrated reporting calendar. Further positive performance may be far more tempered unless a US/Iran agreement is reached.
Nasdaq Breadth:
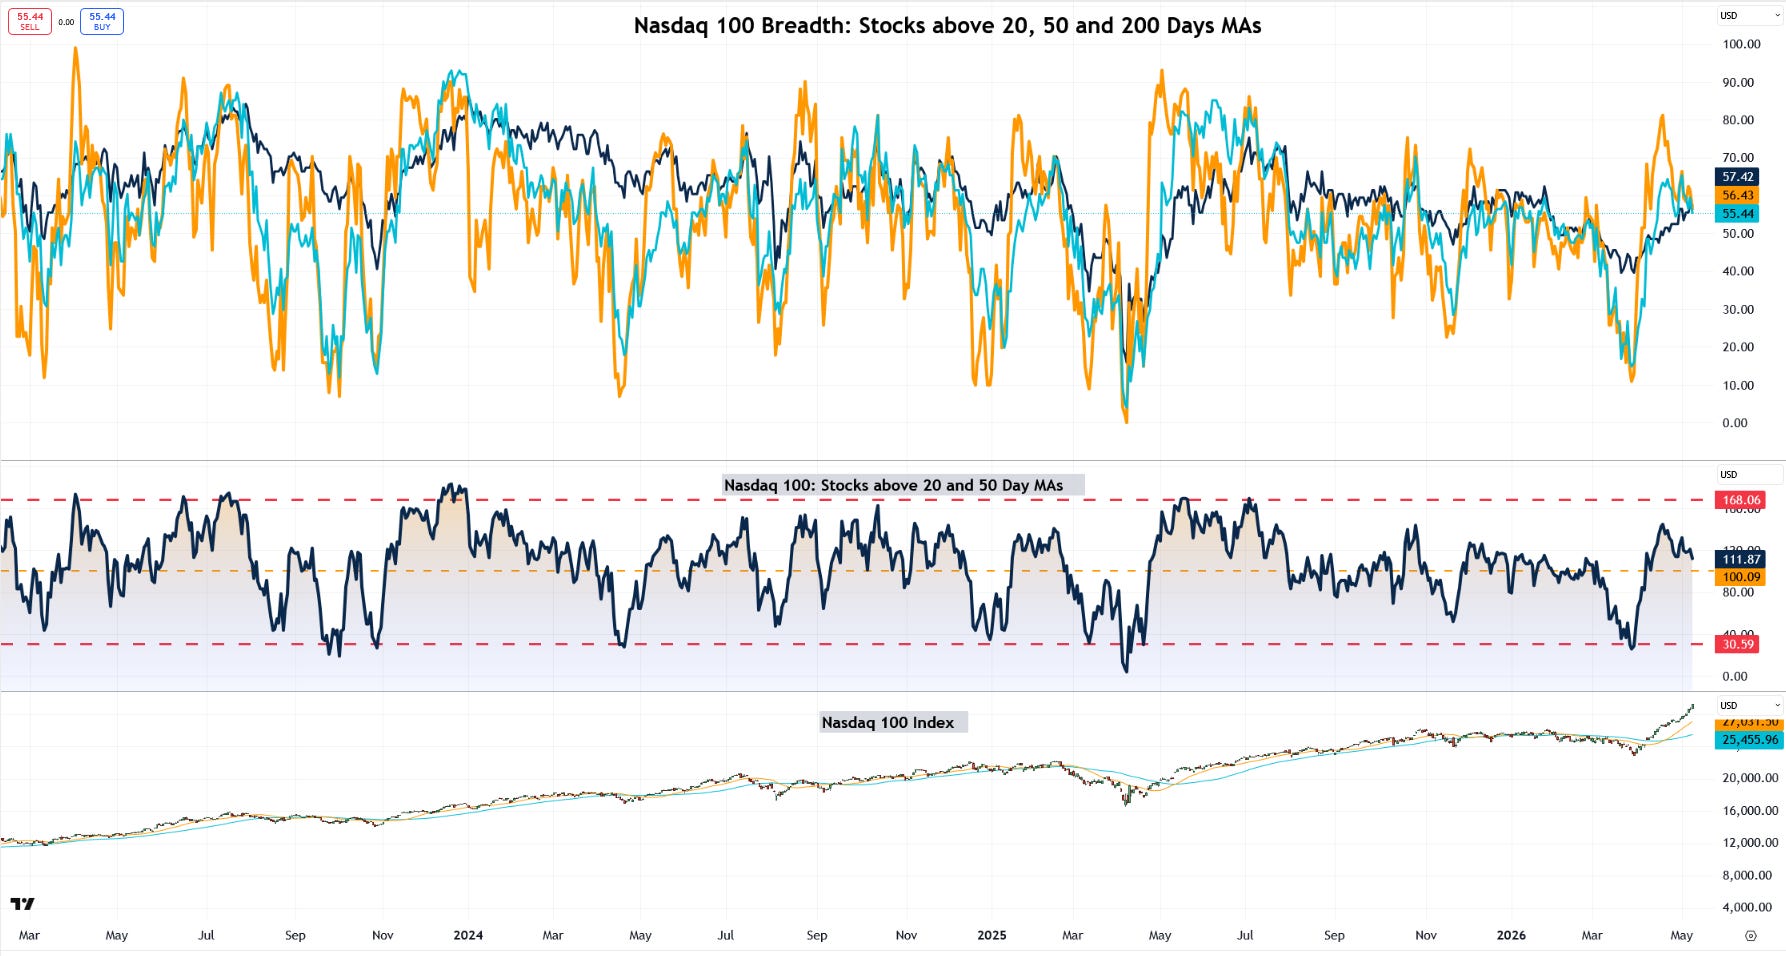
Nasdaq breadth shows a similar picture. The Stocks above their 20 day MA (first to accelerate) has broken below the 50 day indicator. This doesn’t necessarily indicate an imminent pullback in markets, however it generally reinforces a deceleration in equity gains.
Small Cap Breadth:
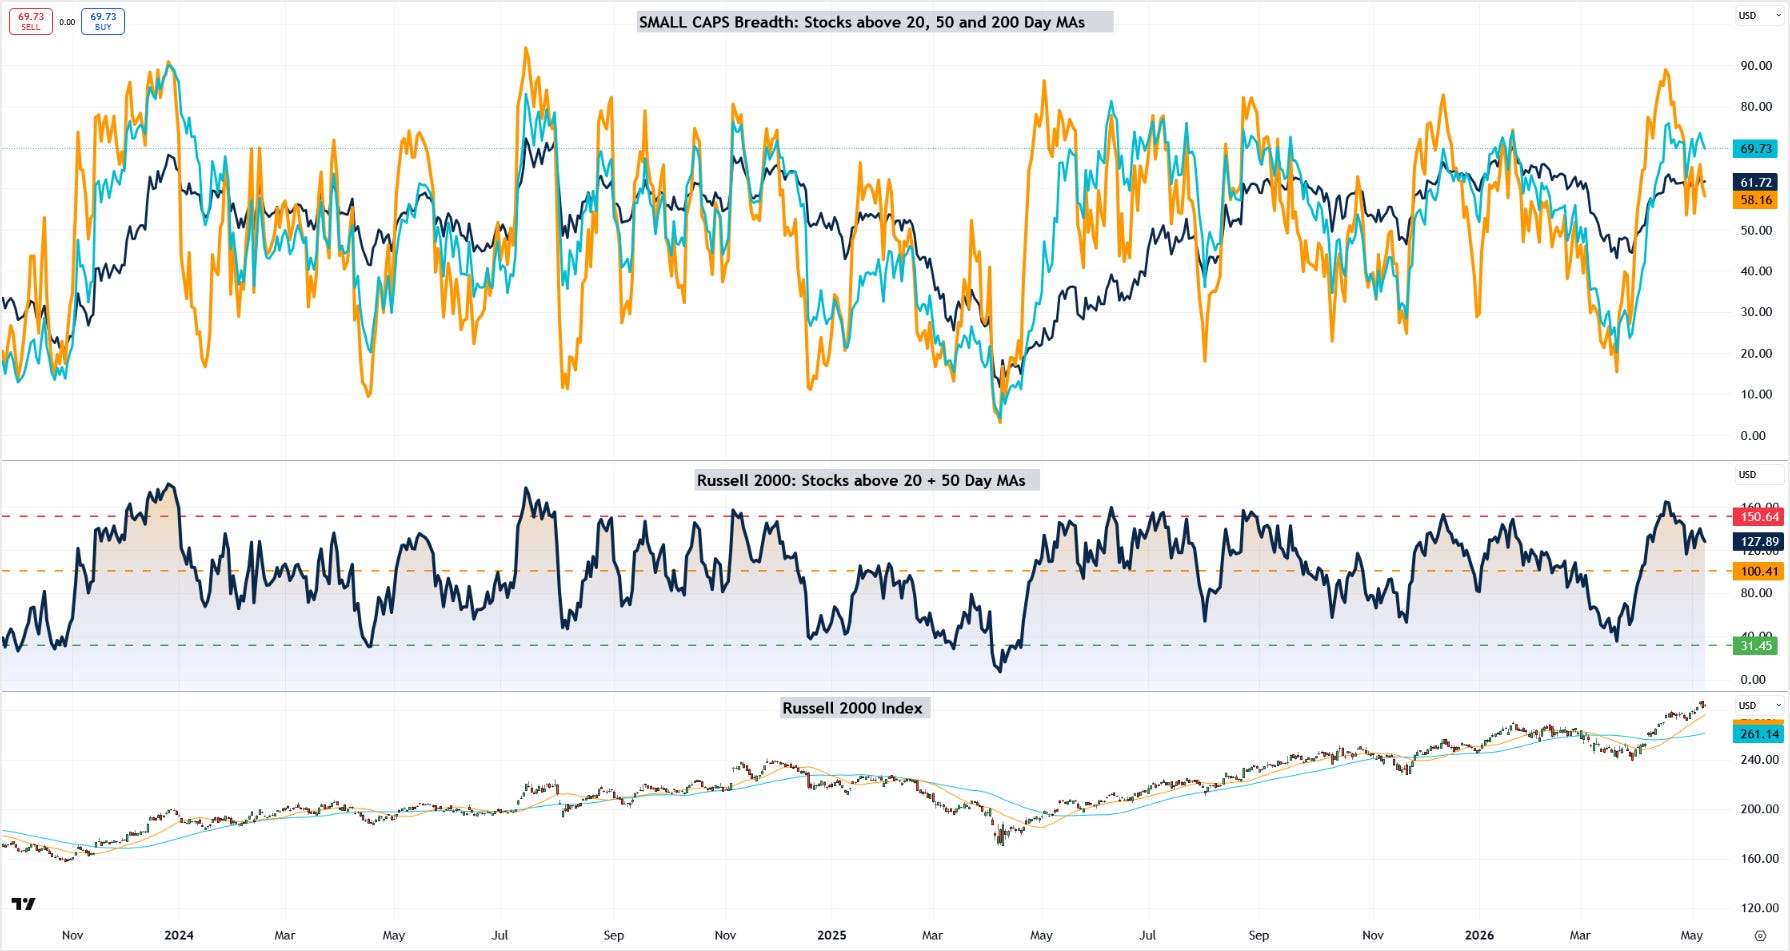
Small Cap breadth has deteriorated more than within the Nasdaq and S&P 500. This may suggest IWM / RTY hedges can work to protect a pullback in markets.
4. Growth continues to underperform Value
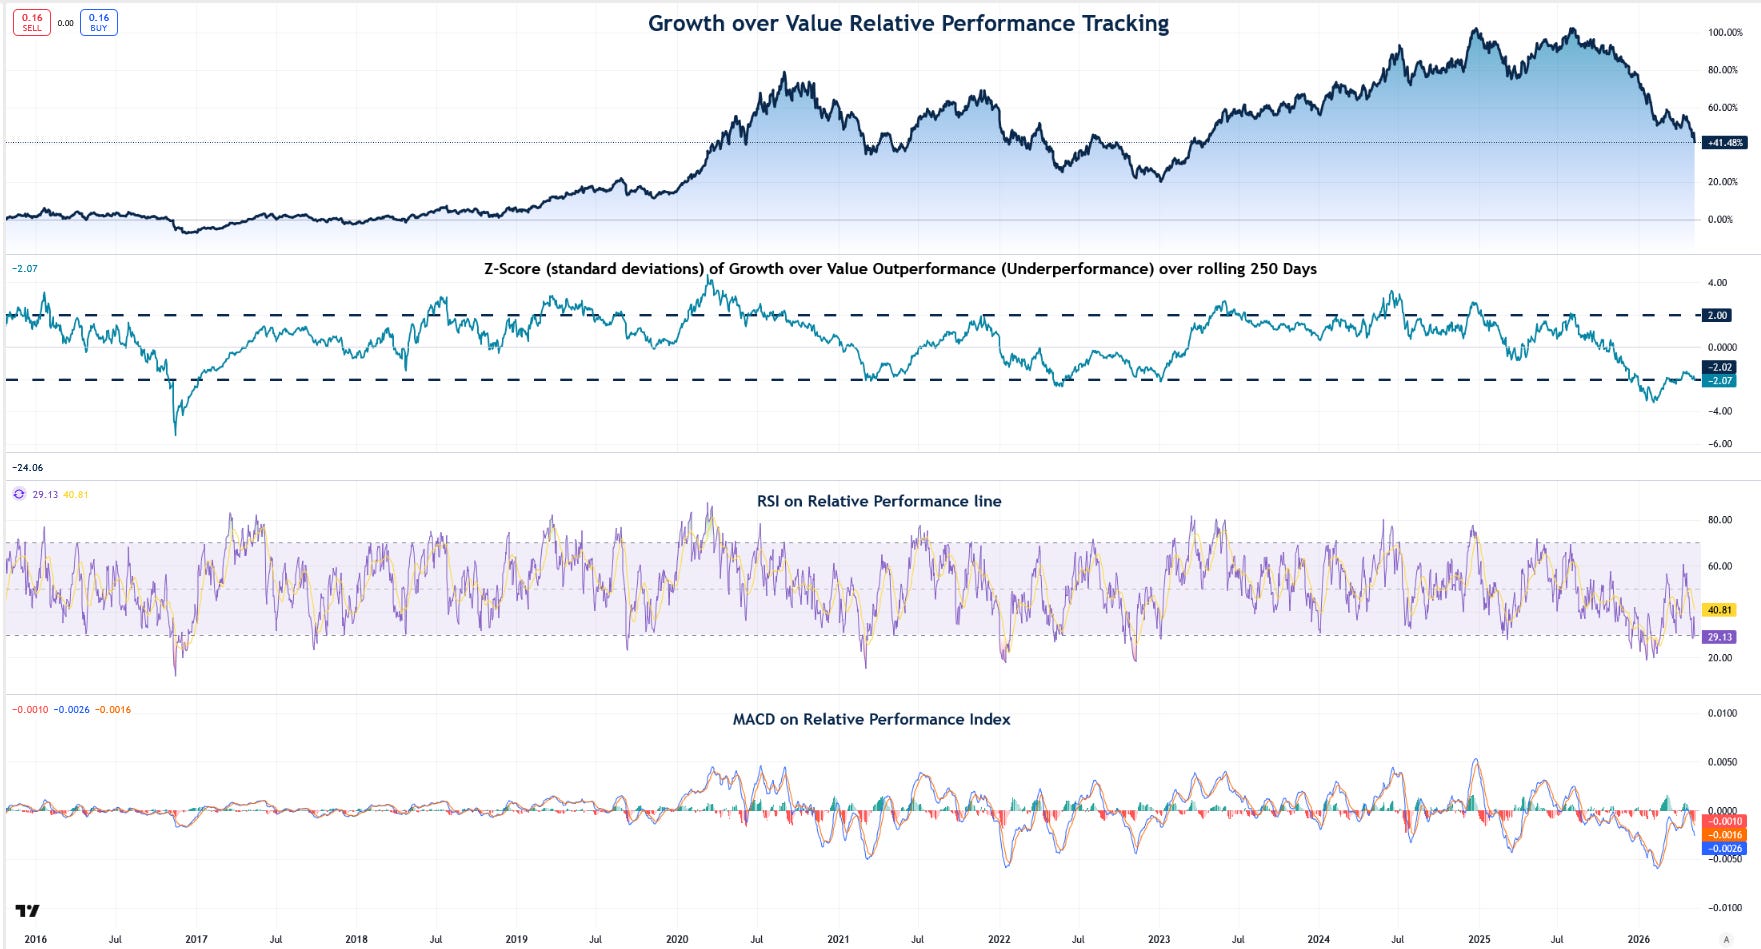
Throughout this conflict, growth has continued to underperform value due to the implications of the oil shock to the stagflationary impulse (higher inflation, higher rate expectations, low real growth). Even in last week’s rapid Nasdaq 100 surge, Growth underperformed Value overall. While the broader market is performing as if the peak in oil and inflation is in, the value / growth internals suggest that timing is critical. Growth’s outperformance of Value may not reassert until we can see the boats moving in volume through the Straight and crude stockpiles start to normalize upwards.
Andy West
The Inferential Investor