Inferent Market Signals - 30th June 2026.
What are the market internals telling us about trends and risk appetite?

Weekly Market Signals Summary
30th June 2026
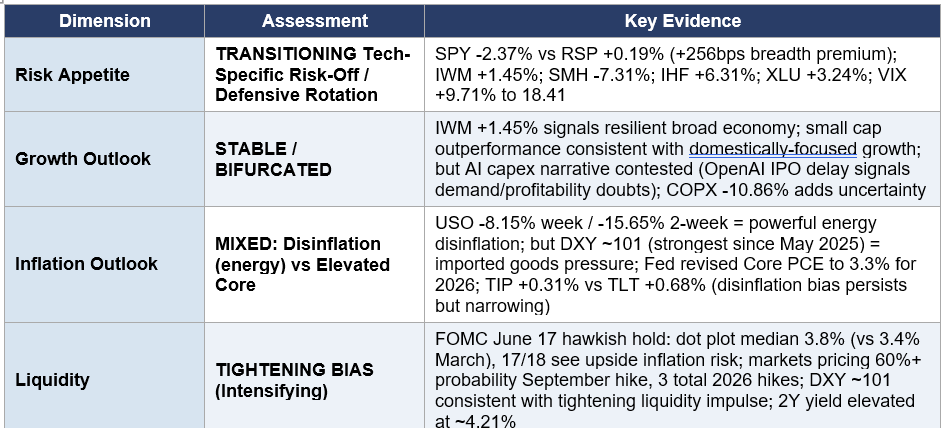
• Regime characterization: TRANSITIONING weaker on macro pressure — AI/Mega-Cap Tech Specific Risk-Off with Broadening Defensive Rotation. The broader market (RSP +0.19%, IWM +1.45%) is NOT in a broad bear; the selloff is concentrated in the largest AI-exposed names (SPY -2.37%, QQQ -4.60%, SMH -7.31%) commensurate with rate hike, but not recession, fears.
• OpenAI IPO delay to 2027 (reported June 25-26) is the week’s most significant new development — it confirms that at $1T+ valuations, institutional advisors see the current AI equity pricing as too rich for public market investors, and removes a key near-term demand catalyst for the AI/semiconductor complex.
• Capital supply overhang signal intensifying: SpaceX (SPCX) has already fallen from its June 16 peak of $225.64 to $153 (-32%), with a June 23 low of $147 — the largest IPO in history is struggling to hold its post-IPO gains within 3 weeks. OpenAI’s delay, combined with SpaceX’s post-IPO softness, signals potential saturation in AI equity demand at current prices.
• Breadth divergence is the most constructive signal: RSP +0.19% vs SPY -2.37% (+256bps premium) is the most extreme single-week breadth outperformance in the 2026 dataset. The 493 non-mega-cap S&P 500 stocks are, in aggregate, advancing — consistent with a rotation not a systemic breakdown.
• Small caps lead: IWM +1.45% vs QQQ -4.60% (+605bps premium). Small-cap outperformance in the face of large-cap tech pressure historically signals the economy is still perceived as sound by domestic-focused market participants.
• Oil collapse continues: USO -8.15% for the week, -15.65% cumulative over two weeks. Brent crude now around $70-73/bbl (-20% from 2026 peak). The Iran/Hormuz geopolitical premium is substantially unwound, providing the dominant disinflationary impulse.
• Dollar strengthening significantly: DXY ~101, strongest since May 2025. Driven by the Fed’s June 17 hawkish pivot — 9 of 18 FOMC members project at least one hike in 2026, with markets now pricing 60%+ probability of a September hike and 3 total 2026 hikes.
• Copper complex collapsed: COPX -10.86% in the week, -11.4% over two weeks with the USD rallying on rate hike probability repricing. The magnitude of the copper miner decline without major idiosyncratic news suggests leveraged commodity position liquidation, flow through from AI weakness and USD strength due to inflationary read throughs to rates driven by Kevin Warsh’s first FOMC press conference.
• Defensive rotation accelerating: IHF (healthcare) +6.31%, XLU (utilities) +3.24%, XLP (staples) +1.72%, IAT (regional banks) +4.96% — all reversed sharply from being sold the prior week. USMV (min-vol) +1.84%. This is the clearest defensive rotation signal since the May 15 stagflation shock.
• Factor regime reversal: USMV (low volatility) and VLUE are the only factors with positive returns this week; MTUM -3.76%, VUG -4.83%, QUAL -1.01% (momentum, growth and quality) are all negative. Low-volatility and value are the new leadership — a definitive defensive factor shift from the growth/momentum regime of the prior two weeks.
• Primary economic distance analog - similarities and differences: Q3-Q4 2018 Fed Hawkish Cycle + Tech De-rating — Fed signaling rate hikes, tech/growth leadership reversing, defensives rotating in, dollar strengthening. From the mid-Q3 2018 analog phase, the S&P 500 fell ~15% to the December 24, 2018 trough before a 25% recovery by April 2019. Net 6-month return from July 2018 was approximately -5%. The 2018 analog however, lacked the strong GDP growth impetus from AI investment which could blunt the overall pressure on equities. It also reflected a long end of the rate curve that was uncontrolled by the Fed. The Warsh Fed appears focused on controlling the long end which dictates equity valuations. Last week’s repricing reflected getting that end under Fed control (removing forward guidance and the chair’s own “dot”). It creates uncertainty for investors that may limit large further gains, but it is not yet sufficient to create absolute downside pressure - further inflation and rate fears are required (with disinflation from oil reducing the probability of that).
• Key forward signals: CPI and PPI data through to the next Fed meeting. This is the primary mechanism through which the AI valuation narrative is repriced. Disinflation is likely to be seen in the data and is somewhat expected. The delta versus consensus is what really matters - sticky inflation drives rate hikes while disinflation will support equities as hike pricing evaporates. Ramping semiconductor capex news is also important. This will be seen as a positive to alleviate unsustainable supply shortages but is long dated in impact. Typically, it would be expected to generate rotation out of semiconductor names towards hyperscalers and other memory consumers on a medium term view that input cost pressure will slow.
• Primary equity implication of the trends being seen and macro drivers: If inflation data stays high, keeping rate hike fears at the forefront, the index-level S&P 500 may consolidate / decline 5% from recent highs over the next month to two months, with AI/mega-tech names bearing the brunt (potential for -10% from peaks), while defensives (healthcare, utilities), small-caps/value, and regional banks could post positive relative returns.
• Key alternative scenario: If the FOMC signals patience rather than executing hikes along with further oil/commodity disinflation) AND OpenAI resolves its IPO timeline at an acceptable valuation, a rapid V-shaped recovery (fourth in 2026) could re-establish the growth / momentum leadership regime.
• For the first time in a while the primary and alternative scenarios have swapped direction but are also appearing quite balanced in probability - this could result in a range bound market. High equity exposure in crowded names such as AI appears a low payoff bet at the current juncture, given binary outcomes and scenario probability. Lower oil brings disinflation to the forefront over the next month which is positive, provided it starts to flow through and US/Iran tensions don’t reignite.
4-Dimension Regime Determination

Let me introduce you to Inferent Analyst. This is a new and unique AI investment research analyst platform being developed right now. Inferent Analyst is designed to be your agentic equity research assistant. No more pages and pages of raw numbers without context like traditional data terminals. Inferent Analyst actually interprets and analyzes the data automatically, as events unfold, to help you discover more ideas and make better investment decisions. Pre-register today for early access benefits.
This report was generated with the Equity Risk Regime research workflow from the INFERENTIAL INVESTOR.
Important Disclaimer: This analysis is subject to The Inferential Investor’s Disclaimer. It is for informational and educational purposes only and does not constitute investment advice, a recommendation to buy or sell any security, an offer or solicitation, or a guarantee of future performance. The information is derived from sources believed to be reliable but no representation or warranty is made as to its accuracy or completeness. Scenario descriptions are not forecasts but explorations of the implications of a set of described conditions and are subjetc to risk and uncertainty. Past performance is not indicative of future results. Readers should consult their own advisers before making any investment decision. AI can make mistakes.
All comments or feedback appreciated on this report format.
Andy West
The Inferential Investor