


Weekly Market Signals 13th July 2026
Summary:
Regime: risk-on but narrowing and increasingly valuation sensitive. Risk appetite is oscillating more frequently week to week and breadth is becoming a low persistence signal. This is consistent with late cycle behavior.
Macro flight-to-safety signals were largely absent for the week.
Macro-sensitive assets moved in a broadly reflationary direction.
Risk-on signals were mixed but tilted positive at the index level and volatility fell despite the third AI/Semiconductor valuation scare of 2026.
Key Moves and Implications
• AI/semiconductor complex had its third distinct scare of 2026. A Bank of America valuation warning and a 7-day, -21% slide in Intel (Jul 1-8) gave way to a sharp Thursday-Friday recovery after SK Hynix’s record $26.5bn Nasdaq debut (ADRs +13% on the first trading day) reaffirmed AI memory-chip demand.
• Breakeven inflation widened. TIP (-0.21%) outperformed TLT (-1.19%) by roughly 98bps this week. Breakevens are the bond market’s implied estimate of future inflation, derived from the yield gap between ordinary Treasuries (TLT) and inflation-protected Treasuries (TIP); a widening this week is consistent with May CPI’s hot 4.2% YoY print and the Fed’s own upward revision to its inflation forecast.
• VIX fell for a third straight week to 15.03 (-4.93%) even though single-stock and sector-level volatility (Intel, semiconductors) spiked mid-week — index-level calm is masking elevated dispersion beneath the surface.
• The Treasury curve continued to bear-steepen (TLT -1.19% vs SHV +0.07%, a ~126bps gap). A bear-steepener is when longer-dated bond prices fall faster than short-dated ones, implying long-term yields are rising relative to short-term yields — often a sign the market is pricing higher term inflation risk or greater bond supply, not necessarily tighter near-term Fed policy.
• Growth/mega-cap leadership dominated factors. VUG (growth) led all factors both this week (+2.25%) and over the trailing two weeks (+5.63% cumulative) — the widest two-week factor spread in the dataset.
• Small caps underperformed for a second straight week (IWM -0.52%), reinforcing the narrowing-breadth signal alongside RSP.
• Next week’s calendar is unusually dense. June CPI (Jul 14) lands the same morning as Q2 earnings from JPMorgan, Bank of America, Citigroup, and Wells Fargo — a rare simultaneous macro-data/bank-earnings cluster that could move markets sharply in either direction.
• Primary economic distance analog: Q3 2024 AI Momentum Pause / Valuation Reset — now in its third recurrence within the current cycle. This continues to characterize the AI complex’s volatility as contained and sector-specific rather than systemic, though the accelerating frequency of these episodes (three in five weeks) is itself notable.
• Key alternative scenario: a 1999-2000-style narrow-leadership, Fed-tightening melt-up, where stretched AI/semiconductor valuations coincide with a genuinely hawkish Fed and rising inflation — a combination that historically preceded sharper, more durable corrections than a simple valuation pause.
• Primary equity implication: index-level resilience may persist near-term given the earnings backdrop and a Fed still on hold, but narrowing breadth and widening breakevens suggest wider-than-usual uncertainty bands are warranted heading into the July 14 CPI/bank-earnings cluster.
• Fed under Chair Kevin Warsh continues a hawkish tilt — five newly announced policy task forces and an upward revision to 2026 inflation projections (to 3.6% headline / 3.3% core) — even with the funds rate unchanged at 3.50-3.75%. This is the current key risk for equities on the visible spectrum.
4-Dimension Risk Regime Determination
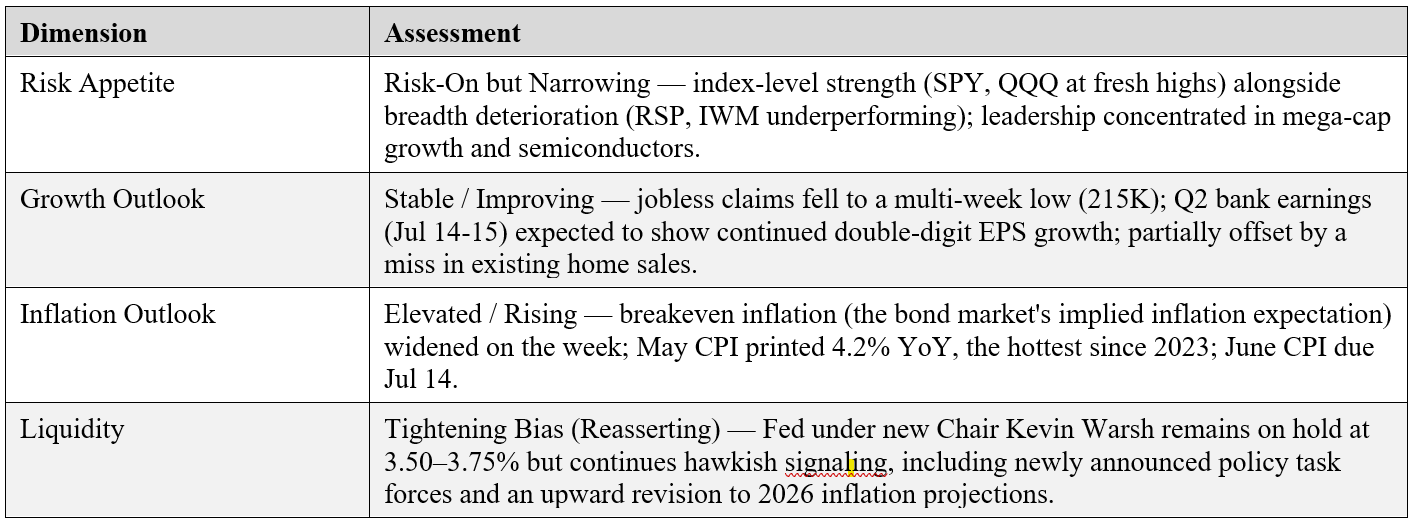
Further detail on key risk appetite lenses follows:

Let me introduce you to Inferent Analyst - a cutting edge AI investment research platform being developed by investors - for investors. Inferent Analyst is designed to be every investor’s autonomous equity research assistant. No more pages and pages of raw numbers without context like traditional data terminals. Inferent Analyst actually interprets and analyzes the data automatically, as events unfold, presenting you with the insights you need to discover ideas and make better investment decisions. Pre-register today as subscriber seats will be limited on launch.
Risk Regime Signals
• Regime: risk-on but narrowing. The S&P 500 (SPY +1.37%) and Nasdaq 100 (QQQ +1.82%) closed the week at fresh highs, but the equal-weight S&P (RSP -0.27%) and small caps (IWM -0.52%) lagged, reversing the brief breadth improvement seen in the prior two weeks.
• Macro-sensitive assets moved in a broadly reflationary direction. Commodities were firm (DBC +3.61%, CPER +1.90%, USO +4.57%), while long-duration Treasuries (TLT -1.19%) and inflation-protected Treasuries (TIP -0.21%) both declined, with TLT falling faster — a combination consistent with firming growth and inflation expectations rather than a growth scare.
• Flight-to-safety signals were largely absent. Despite oil spiking above $80/bbl intraweek on Hormuz tension, TLT continued to sell off (not the behavior expected if investors were rotating into duration for safety), and gold (GLD) was roughly flat (-0.29%). The muted safety bid suggests the market is treating the geopolitical flare-up as transient.
• Risk-on signals were mixed but tilted positive at the index level. Semiconductors (SMH +3.17%, IXN +3.12%) rebounded sharply after mid-week weakness, while industrials (XLI -1.07%) and discretionary (IYC -0.79%) lagged — a signature of narrow, AI-specific risk appetite rather than broad-based cyclical strength.
• Volatility fell at the index level despite elevated single-name dispersion. VIX declined for a third consecutive week to 15.03, even as Intel’s ~21% seven-day drawdown and the broader semiconductor selloff generated significant intra-week stock-specific volatility — a gap between headline calm and underlying turbulence.
• Equity breadth narrowed sharply. SPY (+1.37%) outpaced RSP (-0.27%) by roughly 164bps, and QQQ (+1.82%) outpaced IWM (-0.52%) by roughly 234bps — both breadth measures reversed the broadening seen in the prior week’s report and confirm leadership is concentrated in a small number of mega-cap names.
Inflation vs Growth Signals
• Inflation expectations re-firmed. The TIP-vs-TLT spread (breakevens) widened by roughly 98bps this week and roughly 183bps cumulatively over the trailing two weeks, reversing several prior weeks of disinflationary signaling and aligning with May’s hot CPI print and the Fed’s own upward inflation-forecast revision.
• Growth repricing was mixed. Copper (CPER +1.90%) outpaced copper-mining equities (COPX -0.12%) by 202bps, a modestly constructive physical-demand signal, while broad cyclicals (XLI, IYC) underperformed both the index and defensives — suggesting growth optimism is concentrated in commodity pricing and AI-linked names rather than the broader cyclical complex.
• Small-cap underperformance (IWM -0.52%) for a second straight week argues against a broad-based growth acceleration narrative; large-cap, AI-exposed growth names are driving the tape rather than the domestically-oriented small-cap complex.
• Signal stability was low intraweek. The week featured a sharp Monday-Wednesday AI-capex confidence scare followed by a Thursday-Friday reversal on SK Hynix’s IPO — the third such whipsaw episode in five weeks (following the June 6 Broadcom guidance miss and the June 26 OpenAI IPO delay). Volatile, fast-resolving AI-specific shocks are becoming a recurring feature rather than an isolated event.
• Forward equity environment considerations: valuations remain stretched by several sell-side measures (BofA’s explicit “stretched” call on AI chips, HSBC/BofA divergent Intel price-target commentary reportedly including “bubble risk” language); Q2 earnings growth is expected to remain robust (banks kick off Jul 14-15); the Hormuz ceasefire remains a live but currently contained geopolitical risk; and liquidity conditions continue to tighten at the margin under a hawkish Fed. Together, these suggest a forward equity backdrop that could remain supportive of index-level gains in a base case, but with reduced margin for error around the Jul 14 CPI/earnings cluster and the Aug 26 NVDA report.
Regime Context - Comparison to Prior Weeks
• Risk appetite has continued to oscillate. Breadth swung from extremely narrow (week ending Jun 26) to briefly broad (week ending Jul 3, RSP-SPY gap compressed to roughly +4bps) and has now narrowed again this week (RSP underperforming SPY by 164bps) — the third such swing in six weeks. Breadth is proving to be a volatile, low-persistence signal in the current regime rather than a stable trend.
• Inflation has shifted materially. Prior week’s report characterized inflation as “Uncertain / Bifurcated”; this week’s larger breakeven widening (98bps WoW, 183bps over two weeks) alongside May’s hot CPI print and the Fed’s own upward revision justifies reclassifying the dimension to “Elevated / Rising.” This is a genuine multi-week firming trend worth monitoring into the June CPI release.
• Liquidity has not moderated as the prior week’s report anticipated. The prior report described a “tightening bias moderating”; this week’s newsflow (new Fed task forces, no dovish walk-back) suggests the hawkish tilt is reasserting rather than fading, and the liquidity dimension is revised accordingly.
• The AI/semiconductor volatility pattern is now an established feature of the regime, not a one-off. Three distinct shocks in five weeks (Broadcom guidance, Jun 6; OpenAI IPO delay, Jun 26; BofA/Intel, Jul 1-8) have each resolved within days via a demand-validation catalyst — a repeating cycle that is shaping the character of this cycle’s AI-driven risk regime.
• Growth outlook remains the most stable dimension across recent weeks — consistently assessed as stable-to-improving, supported by resilient labor data and a strong incoming earnings season, with only modest offsetting signals (this week’s existing-home-sales miss).
News and Event Evolution
Emergent / Intensified Themes (Most Recent Week)
• Bank of America flagged AI chip valuations as “stretched,” triggering a sector-wide semiconductor selloff (Jul 1-8); Intel fell roughly 21% over seven trading days on AI-capex-return skepticism and company-specific 18A process-delay reports.
• SK Hynix’s $26.5bn Nasdaq debut (Jul 9-10) — the largest-ever US listing by a foreign company — priced at $149/ADR and traded up as much as 14% at the open; demand was reported at more than 7x the offered shares, and management publicly characterized AI memory demand as “enormous.” This functioned as a rapid confidence-restoring catalyst after the week’s early AI-capex scare.
• Weekly jobless claims fell to 215,000 (from prior data, below the ~223,000 consensus), a resilient-labor-market signal.
• Existing home sales missed consensus (4.09mn vs. 4.19mn expected), introducing an incremental housing-softness data point.
Constant Themes (Both Weeks)
• AI capital-expenditure sustainability debate — ongoing since the early-June Broadcom guidance miss and the June 26 OpenAI IPO delay, and still the dominant swing factor for equity volatility.
• Iran / Strait of Hormuz — a fragile ceasefire holding with intermittent tension spikes; oil remains sensitive to headline risk from indirect US-Iran talks.
• Fed hawkish tilt under new Chair Kevin Warsh, persisting since the June 17 FOMC’s hawkish dot-plot shift.
• Elevated inflation backdrop — May CPI’s 4.2% YoY print (hottest since 2023) continues to frame market expectations ahead of the June release.
Fading Themes (Most Recent Week)
• SpaceX post-IPO weakness narrative — less prominent in newsflow this week relative to the prior two weeks.
• OpenAI IPO delay — superseded as the dominant IPO story by SK Hynix’s listing.
• June nonfarm payrolls miss — largely digested; newsflow attention shifted to weekly claims and housing data.
Important Disclaimer: This analysis is subject to The Inferential Investor’s Disclaimer. It is for informational and educational purposes only and does not constitute investment advice, a recommendation to buy or sell any security, an offer or solicitation, or a guarantee of future performance. The information is derived from sources believed to be reliable but no representation or warranty is made as to its accuracy or completeness. Scenario descriptions are not forecasts but explorations of the implications of a set of described conditions and are subject to risk and uncertainty. Past performance is not indicative of future results. Readers should consult their own advisers before making any investment decision. AI can make mistakes.
Andy West
The Inferential Investor
