Inferent Equity Risk Regime Monitor: 1st June 2026
What are the market internals telling us about markets, sectors, factors and risk appetite?

The following report was generated with the Equity Risk Regime research workflow from the INFERENTIAL INVESTOR.
Important Disclaimer: This analysis is subject to The Inferential Investor’s Disclaimer. It is for informational and educational purposes only and does not constitute investment advice, a recommendation to buy or sell any security, an offer or solicitation, or a guarantee of future performance. The information is derived from sources believed to be reliable but no representation or warranty is made as to its accuracy or completeness. Any forward looking statements reflect potential scenario views, not forecasts and are subject to risk and change. Past performance is not indicative of future results. Readers should consult their own advisers before making any investment decision. AI can make mistakes.
Weekly Market Risk Regime Analysis
1st June 2026
The following report is designed for casual readers to explore the key messages through the executive summary and scenario explorations. The remainder of the report contains greater detail and analysis of the reasoning behind these scenarios, for those with a deeper focus.
Executive Summary
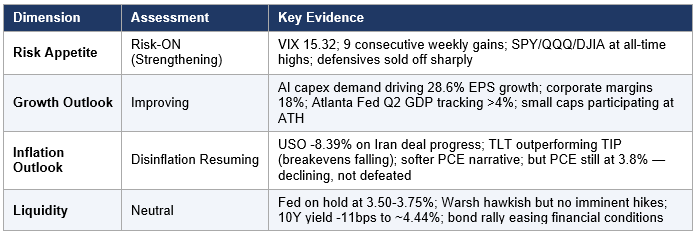
• Regime confirmed Risk-ON, strengthening for a second consecutive week. VIX closed at 15.32 (a 9-week low), SPY / QQQ / DJIA / Nasdaq all reached all-time highs, and the S&P 500 posted its 9th consecutive weekly gain — the longest winning streak since early 2024.
• Primary catalyst: US-Iran Strait of Hormuz MOU framework. US and Iranian negotiators reached a 60-day memorandum of understanding (per Axios, May 28) — pending Trump final approval — for unrestricted shipping, mine clearance within 30 days, and a nuclear non-proliferation commitment. Markets front-ran the announcement aggressively.
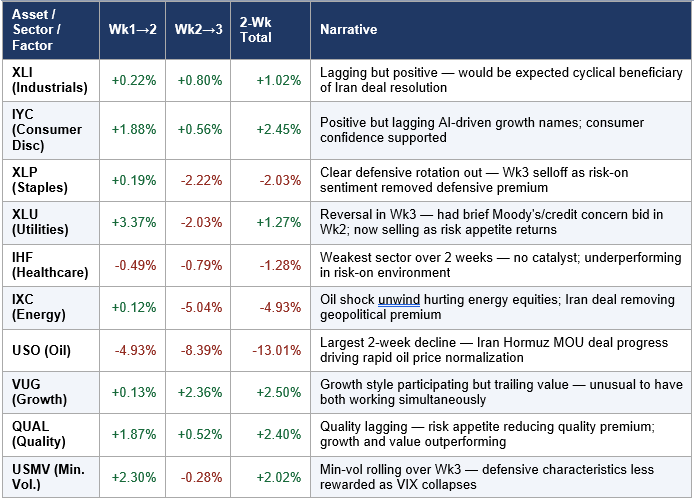
• Oil collapsed: USO -8.39% for the week (-13.0% over 2 weeks), the largest geopolitical premium unwind since the Gulf War. The near-10% weekly decline in oil directly triggered the inflation risk premium repricing across all asset classes.
• Bond yields fell ~11bps (10Y to ~4.44%) as the Iran deal removed the acute inflation shock narrative. TLT +1.29%; TLT outperformed TIP (breakevens fell) — a consistent disinflation signal for the second consecutive week. This is notable: bonds and stocks both rallied together, signalling genuine inflation expectation compression rather than a growth scare.
• AI/tech re-accelerated sharply. IXN (global tech) +6.26%, SMH (semis) +3.92%; Dell Technologies surged 30%+ on AI server orders ($24.4bn in AI orders; $60bn FY27 AI server revenue guidance). S&P 500 EPS growth revised to 28.6% (from 14.4% in April); 83% beat rate on Q1 earnings.
• Factor breadth signal: VLUE +5.77% and MTUM +4.03% both working simultaneously — unusual co-movement indicating both (1) cyclical/value recovery on geopolitical relief and (2) AI/tech momentum. This dual-factor strength is a hallmark of mid-cycle risk-on regimes.
• Defensives sold off sharply: XLP -2.22%, XLU -2.03% — the clearest confirmation of risk-on rotation. Minimum-volatility factor (USMV) -0.28%; defensive bid fully unwound.
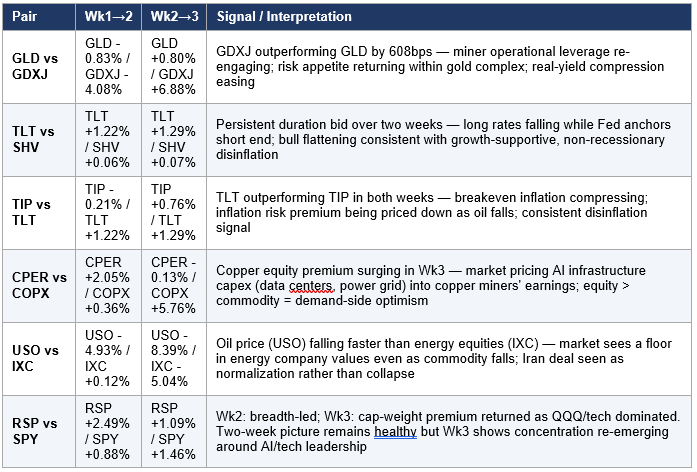
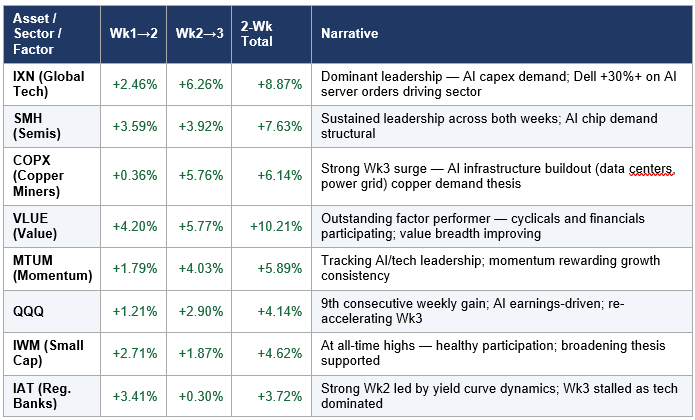
• Breadth healthy but concentration partially re-emerging. RSP +1.09% vs SPY +1.46% — cap-weight premium returned as QQQ-led tech dominated Wk3 (reversing Wk2 where RSP led +2.49% vs SPY +0.88%). Overall breadth remains constructive: IWM +1.87%, small cap at ATH.
• Copper miners (COPX +5.76%) surging on AI infrastructure demand thesis — data centers and power grid buildout are copper-intensive. Physical copper (CPER -0.13%) lagged, creating an equity premium in the copper space.
• Primary Economic Distance Analog: Q1-Q2 1991 Gulf War Ceasefire. Markets are in the “ceasefire announced / oil collapsing / equities rallying” phase of the 1991 analog. From the equivalent phase (late Jan 1991), the S&P 500 advanced ~18% over 6 months with tech and cyclicals both participating.
• Fed on hold: Warsh hawkish but not hiking. Rate at 3.50-3.75%; softer PCE narrative (April PCE 3.8% vs 4%+ energy-driven peak) reducing near-term hike risk. No imminent catalyst for policy reversal barring Iran deal collapse.
• Key risk / alternative scenario: Iran deal has not received Trump final approval. If the MOU collapses, oil re-spikes, the stagflation regime re-emerges, and the market faces a sharp reversal — particularly in growth/tech and small caps. The speed of the current rally (built on deal anticipation) is the primary vulnerability.
• VIX at 15.32 approaches the “complacency zone” below 15. While the fundamental backdrop supports lower volatility, the mismatch noted in market commentary — low VIX but cautious underlying trader sentiment — warrants monitoring. A volatility spike from 15 to 20 would not require a fundamental deterioration.

Before we continue, let me introduce you to Inferent Analyst. This is the state-of-the-art AI investment research analyst project being developed right now. Inferent Analyst is designed to be your agentic equity research assistant. No more pages and pages of raw numbers without context, like traditional data terminals. Inferent Analyst presents data with synthesized context and insight to help you discover more ideas and make better investment decisions. Pre-register today for a bonus on launch.

Regime Determination — Four-Dimension Summary
Equity Market Implications - Primary Scenario
Scenario: Iran Deal Signed — Geopolitical Relief Rally Extension
• In a scenario where Trump approves the Hormuz MOU (most likely 1-2 weeks), the current risk-on regime could potentially persist through Q3 2026, consistent with the Q1 1991 primary analog. From the ceasefire phase in 1991, equities advanced ~18% over 6 months.
• The fundamental underpinning is strong: corporate margins at 18%, EPS growth revised to 28.6%, AI capex cycle in full swing (Dell, NVIDIA, hyperscalers all reaffirming), and a normalizing oil price providing a tailwind to consumer discretionary and manufacturing margins.
• Yield environment supportive: If 10Y yields continue declining toward 4.20-4.30% on the Iran deal confirmation and softer PCE trajectory, financial conditions would ease further — providing a P/E expansion tailwind for equity multiples, which could justify the ~20.9x forward P/E if EPS growth remains elevated.
Preferred Sectors and Factors under the Primary Scenario
• Technology (IXN, SMH, QQQ): AI demand structural and accelerating; semis and global tech ETFs would likely continue to lead. Dell’s guidance ($60bn AI server revenue FY27) implies multiple quarters of demand visibility. AI is not late-cycle in this scenario — it is mid-cycle.
• Copper Miners and Materials (COPX, XLB): AI infrastructure buildout (data centers, power grids) is copper-intensive. If the AI capex cycle sustains, copper miners could outperform the underlying commodity — the equity premium is being justified by structural demand expectations.
• Value Factor (VLUE): Continues to benefit from (a) cyclical recovery as Iran premium unwinds, (b) financials normalizing as yields stabilize, (c) broad market participation beyond AI. VLUE’s +10.21% 2-week advance may slow, but the regime is supportive.
• Industrials (XLI): Geopolitical reconstruction demand and AI infrastructure capex could drive industrial earnings. XLI has lagged (+1.02% over 2 weeks) and may offer catch-up potential if growth optimism sustains.
• Momentum (MTUM): Tracking AI/tech earnings leaders; in a sustained risk-on environment, momentum rewarding consistent earnings growers would be expected to persist.
• Sectors and factors to underweight in this scenario: Defensives (XLP, XLU, IHF) — the insurance premium has been unwound and would not re-emerge in a confirmed risk-on regime. Energy (IXC, USO) — oil normalising to lower levels removes the earnings tailwind for energy equities. USMV — minimum volatility premium disappears when VIX is below 15.
Equity Market Implications - Alternative Scenario (Balanced Risk Assessment)
Scenario: Iran Deal Collapses — Stagflation Regime Re-emerges
• Probability assessment: The alternative scenario could materialise if Trump rejects the MOU, Iran resumes Hormuz activities, or the 60-day negotiation window collapses without a sustainable resolution. Given current negotiating dynamics (MOU agreed at working level, awaiting Trump approval), this scenario may carry a 25-35% probability over the near term.
• In this scenario, oil would likely re-spike toward prior highs (USO potentially back to $140-150 range); the 10Y yield would re-test the 4.65-4.70% range; VIX would spike from 15 back toward 20-22; and the stagflation regime characterised by the week ending May 15 would re-assert.
• Equity market impact would be asymmetric: Growth/tech and small caps — which rallied most aggressively on geopolitical relief — would reprice most sharply. SPY could give back 3-5% within weeks; QQQ could reprice -5 to -8% if the AI narrative decouples from the macro backdrop.
• What would drive this scenario: (1) Trump demands more concessions (e.g., full nuclear dismantlement vs. enrichment pause) creating an impasse; (2) Iranian domestic politics reject the MOU terms; (3) US-Israel dynamics complicate the deal (Israel may prefer Iran without nuclear program remaining capable); (4) Hormuz clearing slower than expected, preventing supply normalization.
Preferred Sectors and Factors in the Alternative Scenario
• Energy (IXC, USO): Direct beneficiary of oil re-spike. IXC would rapidly recover losses as energy equities track the commodity higher.
• Consumer Staples (XLP) and Healthcare (IHF): Defensives would recover their insurance bid as risk appetite reverses. XLP -2.22% and IHF -0.79% in Wk3 would partially retrace.
• Utilities (XLU): Would recover yield premium if risk appetite falls and investors seek dividend income.
• Quality (QUAL) and Minimum Volatility (USMV): Factor positioning would rotate back to quality and low-vol defensives as volatility spikes.
• Gold (GLD): Gold has maintained elevated levels throughout — in the alternative scenario, gold would likely surge as macro tail hedging demand returns. GLD +5-10% from current levels would be consistent with a risk-off re-rating.
• In the alternative scenario, TLT would sell off (yields spiking on stagflation return), COPX and VLUE would reprice lower, and the AI/tech trade would face significant multiple compression as higher real yields re-emerge.
Newsflow Evolution - the context behind the moves
Themes Emergent or Intensified in Week Ending May 29
• US-Iran Hormuz MOU: Axios (May 28) reported US and Iranian negotiators reached a 60-day MOU on unrestricted shipping, mine clearance, and nuclear non-proliferation — pending Trump approval. This was the dominant market catalyst of the week.
• Oil price collapse and stagflation risk removal: USO -8.39%; Brent crude fell ~10%; EIA projected oil market rebalancing as Hormuz flows resume. The PCE energy component (which drove April PCE to 3.8%) is expected to normalise, sharply reducing the stagflation tail.
• Technology/AI re-acceleration: Dell +30%+ (AI server orders; $24.4bn pipeline); IXN +6.26%; S&P Tech (XLK) +5.6% for the week and +19% for May. AI narrative re-established as the equity cycle’s primary structural driver.
• All-time highs across indices: S&P 500, DJIA, and Nasdaq Composite all reached ATH on May 29. Major indices posted their 9th consecutive weekly gain. Equal-weight S&P 500 and small caps also reached ATH — confirming broad market health.
• Value factor surge: VLUE +5.77%, co-moving with momentum (+4.03%). Value recovered as cyclicals (COPX, XLB, XLI) participated alongside tech. This dual-factor co-movement signals mid-cycle broadening.
• Defensive selloff: XLP -2.22%, XLU -2.03%, USMV -0.28% — risk premium fully unwound. The previous week’s utility rally (+3.37%) on credit/Moody’s concerns was fully reversed.
• PCE softer narrative: April PCE at 3.8% (vs. March 3.5%) — still elevated but below the shock-peak implied trajectory. The Fed’s preferred inflation gauge declining from the Iran-war energy spike reinforced the disinflation thesis.
Themes That Faded in Week Ending May 29
• Stagflation risk premium: The May 15 regime (CPI 3.8%, PPI +1.4%, 10Y at 4.7%) was effectively priced out over two weeks. Oil falling and yields declining simultaneously marked the definitive fading of the acute stagflation narrative.
• Moody’s US downgrade concerns: The Moody’s Aa1 downgrade (absorbed week of May 19) is no longer a market driver. 30Y yield retreating from 5.19% peak toward 4.9-5.0% confirmed credit concern was episodic.
• Flight-to-safety bid: DXY/UUP essentially flat (-0.36%); gold muted (+0.80%); defensive sectors underperforming. The macro tail hedges placed during the stagflation shock have been unwound.
• Fed Chair uncertainty premium: Warsh uncertainty was highest in week of May 15-22; by May 29, markets have formed a clearer view of his hawkish-but-not-hiking posture. Policy uncertainty risk premium has compressed.
Themes Constant Across Both Weeks (May 22 and May 29)
• Iran/Strait of Hormuz resolution trajectory: Two-week consistent narrative arc — ceasefire extended indefinitely (Apr 21), then MOU framework agreed (May 28). Markets progressively priced in deal completion, driving oil lower each week.
• AI/tech earnings acceleration: AI-driven demand continued to support earnings surprises. Strong beat rate (83%), rising EPS growth estimates (14.4% → 28.6%), and concrete AI capex commitments (Dell, NVIDIA, hyperscalers) provided fundamental underpinning for equity gains.
• VIX compression: VIX declined -9.39% (Wk1→2) and -8.26% (Wk2→3) — two consecutive weeks of sharp volatility collapse. This is consistent with episodic-shock narrative fading rather than structural volatility regime shift.
• Fed on hold, Warsh hawkish: Kevin Warsh (confirmed Fed Chair replacing Powell, May 15) maintained hawkish tone throughout — committed to balance sheet reduction, signalling no imminent cuts. Markets accepted this as neutral rather than negative given the disinflation trajectory.
• Strong corporate earnings: Q1 2026 earnings season concluded with the highest EPS beat rate since Q2 2021 (83-84%) and blended EPS growth of 28.6%. Corporate margins reached 18% (near post-COVID highs) — the earnings floor is providing fundamental support.
Cross-Asset Risk Regime Synthesis
Macro-Sensitive Assets
• Commodities: USO -8.39% (oil) and DBC -3.44% (broad commodities) both declining sharply on Iran deal progress — supply shock narrative reversing. IXC (energy equities) -5.04%, declining less than the commodity, suggesting the market prices a floor in energy company earnings at normalised oil levels.
• Metals split: COPX (copper miners) +5.76% and XLB (materials) +1.73% advancing despite CPER (physical copper) -0.13%. The equity-commodity divergence in copper reflects AI infrastructure demand expectations — copper equity owners are being repriced for the structural demand outlook, independent of spot price.
• Gold: GLD +0.80% — a mild recovery after two weeks of geopolitically-driven selling. Gold not rallying strongly despite stocks at ATH suggests the debasement/tail-risk bid is partially intact. Gold’s modest gain in a risk-on week is a mild residual caution signal.
• Fixed Income: TLT +1.29% (long bonds rallying, yields falling ~11bps on 10Y to ~4.44%), SHV +0.07% (short end anchored by Fed). TIP +0.76% (inflation-protected bonds up, but less than TLT — breakevens falling). Two consecutive weeks of TLT > TIP = persistent disinflation signal from the bond market.
• Currency (DXY proxy via UUP): -0.36% — mild USD weakness consistent with risk-on appetite and declining real yields. Not a meaningful safe-haven outflow or risk-off signal; reflects carry dynamics normalizing.
Risk Barometers
• VIX: 15.32 — a 9-week low, down -8.26% for the week (-17.4% cumulative over 2 weeks). The speed of VIX compression (from 18.43 on May 15 to 15.32 on May 29) mirrors the 2023 Israel-Hamas initial shock resolution. Approaching the <15 “complacency” zone. Note: market commentary flagged a disconnect between low VIX readings and more cautious underlying trader positioning.
• Gold vs. Gold Miners (GLD vs GDXJ): GLD +0.80%, GDXJ +6.88% — GDXJ outperforming by 608bps. Miners’ higher operational leverage rewarded as risk appetite improved. The reversal from Wk2 (where GLD led on real-yield compression) to Wk3 (where GDXJ leads on risk appetite) is significant. Note GDXJ remains -2.52% below May 15 levels on a 2-week basis — still net negative, but with strong momentum reversal.
• Equity Breadth (SPY vs RSP): SPY +1.46% vs RSP +1.09% in Wk3 — slight cap-weight premium (QQQ tech concentration). However, the 2-week picture shows RSP broadly advancing; RSP +3.62% vs SPY +2.35% over two weeks. IWM at all-time highs confirms genuine breadth.
• Cyclicals vs. Defensives: Clear risk-on tilt. Cyclicals (IXN +6.26%, COPX +5.76%, SMH +3.92%) dramatically outperformed defensives (XLP -2.22%, XLU -2.03%, IHF -0.79%). The rotation is broad, not narrow.
Inflation vs Growth Dynamics
• Inflation expectations declining: TIP vs TLT — TLT outperformed TIP in both Wk2 and Wk3, suggesting the bond market’s implied inflation breakeven is falling. Breakeven inflation (the difference between nominal and real yields — what the bond market expects inflation to average over 10 years) is declining as oil falls. The Iran deal is being priced as a structural inflation reducer, not just a temporary dip.
• Hard data still hot: April PCE at 3.8% (up from 3.5% in March), energy component +17.9% YoY. This confirms inflation is not yet defeated — it reflects the oil shock lag. The market is correctly pricing the energy component as transitory (Iran-driven), while the core/services inflation path (less affected by oil) remains the ongoing concern.
• Growth repricing upward: Cyclicals (COPX +5.76%, XLI +0.80%, IYC +0.56%) advancing alongside growth tech (IXN +6.26%) — both legs of the risk-on trade working simultaneously. This is not a defensive rally or a pure AI story; it reflects genuine growth confidence. Corporate margins at 18% (domestic non-financial, Q1 data) — near post-COVID highs — confirm earnings power is intact.
• Copper-gold ratio: CPER -0.13% vs GLD +0.80% — the copper-to-gold ratio edged slightly lower for the week. This is a mild signal suggesting growth repricing is not yet as aggressive as the equity market implies. The ratio remains elevated by historical standards after Wk2’s strong copper move (+2.05%). Watch this ratio as a leading indicator — a sustained rise would confirm the growth acceleration thesis.
• Small caps vs. large caps (IWM +1.87% vs QQQ +2.90%): Large cap growth leading over small, but IWM at ATH. Small cap relative underperformance to mega-cap tech is normal in AI-driven rallies. The absolute level of small caps at ATH is the constructive signal; the relative gap to QQQ would widen further if AI concentration intensifies.
• Signal stability: Both weeks show consistent directional trends — oil down, yields down, tech up, defensives down. The signal is trending consistently, not volatile week-to-week. This consistency is the strongest argument for regime persistence (vs. the May 15 single-week shock which was quickly reversed).
• Forward equity environment: Currently elevated valuations (~20.9x forward P/E — above 5- and 10-year averages) are being supported by above-trend earnings growth (28.6% blended EPS). The AI capex cycle could justify elevated multiples if the earnings acceleration sustains beyond Q1 2026.
Paired Security Signals
Most telling paired divergences, with two-week percentage moves for each pair:
Sector Rotation & Factor Signals
Two-week percentage moves with narrative interpretation. Sorted by 2-week total within group.
Rotation Pattern Synthesis
• The rotation narrative is dual-tracked: (1) AI/tech re-acceleration (IXN, SMH, QQQ) driven by AI capex demand and earnings beats, and (2) geopolitical relief value re-rating (VLUE, COPX, XLB, XLI) as Iran premium unwinds.
• VLUE (+10.21% over 2 weeks) is the standout factor performer — outperforming all other factors. This is a mid-cycle signal: value factors typically lead when (a) the market broadens from narrow leadership and (b) cyclical recovery themes are credible. Both conditions are present.
• MTUM (+5.89% over 2 weeks) co-moving with VLUE is unusual but explainable: momentum is tracking AI/tech earnings leaders (high-quality growers with consistent beats), while value tracks the geopolitical recovery. Two different momentum clusters are driving MTUM simultaneously.
• Defensives (XLP, XLU, IHF) underperforming across both weeks signals a clean rotation out of the “insurance” positioning built during the stagflation shock. This is healthy and consistent with a genuine regime normalisation.
• USMV rolling over in Wk3 (-0.28%) while VIX collapses is structurally consistent: when fear is low (VIX sub-16), minimum-volatility factor premium disappears. This is not a negative signal — it is the expected behavior in a risk-on normalisation.
• Economic cycle positioning indicated: The combination of leadership (IXN, VLUE, COPX, IWM ATH, XLI positive) is consistent with mid-to-early-late cycle positioning — the expansion is intact, earnings are accelerating, but there is no sign of the late-cycle defensive hoarding or credit stress that precedes slowdowns.
Economic Distance Analogs
Primary Analog: Q1-Q2 1991 — Gulf War Resolution
• Period: October 1990 – July 1991 (Desert Shield → Desert Storm → Ceasefire → Recovery).
• Key Similarities: US-led military action against a major Middle East power; oil supply shock as the dominant macro variable; ceasefire (January 17-28, 1991) drove oil prices lower by ~30% in days; equities rallied sharply on peace prospects; the resolution removed a stagflationary supply shock and enabled a return to growth pricing; tech and consumer cyclicals emerged as leaders in the recovery phase.
• Key Differences: Fed in 1991 was in an active rate-cutting cycle (Greenspan) — current Fed is on hold with a hawkish chair. The 1991 US economy was in recession (Q1 1991 GDP -1.9%); current economy is growing with positive Q2 GDP tracking. There is no 1991 equivalent to the AI revolution as a structural demand driver. Scale of Iranian nuclear stakes exceeds the 1991 sovereignty dispute. The 2026 deal is still awaiting Trump approval — 1991 formal ceasefire was cleaner.
• Current Phase Within Analog: Late January 1991 equivalent — ceasefire announced, oil collapsing, markets making new highs on geopolitical relief, but the formal deal is not yet signed. Markets front-ran the formal peace in 1991 by 2-3 weeks. Current market may be in the same position relative to Trump’s approval.
• Equity Performance from this Phase (Feb-Aug 1991): S&P 500 advanced ~18% from the ceasefire (Jan 17) to August 1991 peak. Technology and consumer cyclicals led. Small caps caught up 2-3 months after the initial rally. The advance included a 5-7% pullback in April 1991 (budget concerns) before resuming. Pattern would be consistent with a continued rally through Q3 2026 with a mid-cycle consolidation.
Secondary Analog 1: Q4 2023 / Q1 2024 — AI Boom + Geopolitical Stabilisation
• Period: October 2023 – April 2024.
• Key Similarities: AI-driven earnings acceleration as the structural demand narrative; multiple ATH in equity indices; VIX declining from episodic spike; Fed on hold; geopolitical risk (Israel-Hamas) initially elevated then stabilising; tech/semis dominant leadership; S&P 500 EPS growth revised sharply upward.
• Key Differences: That analog had lower inflation (CPI declining from 3.2% toward 2.5%); current PCE at 3.8% with recent oil shock. Fed in late 2023 was signalling cuts; Warsh is signalling holds. The geopolitical risk in 2023 was regional containment; the 2026 Iran war (with Hormuz closure) was larger scale.
• Current Phase Within Analog: Late November 2023 equivalent — market had already rallied ~10% from the October lows, AI narrative dominant, breadth improving, VIX low. From that phase (late Nov 2023), the S&P 500 advanced a further 10-15% through Q1 2024 before the April 2024 correction on rate-cut delay expectations.
• Equity Performance from this Phase: S&P 500 +12% (Nov 2023 – Mar 2024), tech/semis +20%+, small caps lagged until mid-Jan 2024. Correction of ~5% in April 2024 on Fed pushback. The pattern would suggest continued advance through Aug-Sep 2026 with elevated risk of a correction if the Fed delays cutting or if Iran deal terms disappoint.
Secondary Analog 2: H1 2004 — Elevated Inflation + Strong Earnings + Fed Transition
• Period: January 2004 – June 2004.
• Key Similarities: Elevated energy prices (oil above long-run trend); strong corporate earnings growth; market at above-fair-value levels; geopolitical risk (Iraq) present but not market-moving; Fed transitioning toward normalization (first hike June 2004); value and cyclicals working alongside growth; broad equity breadth.
• Key Differences: No AI structural demand driver in 2004; Greenspan’s tightening cycle was universally anticipated and orderly; 2026 Warsh’s policy path is uncertain (mandate from Trump to cut, but hawkish instincts suggest resistance). 2004 VIX averaged 15-17 (similar to current level). 2004 EPS growth was strong (~20%) but not AI-driven.
• Current Phase Within Analog: Early-to-mid Q1 2004 equivalent — market making ATH, earnings strong, inflation present but not alarming (PCE ~2.8% in early 2004 vs. 3.8% currently — inflation higher in 2026). From this phase in 2004, the S&P 500 treaded water (+3-5%) through H1 2004 before breaking higher in H2.
• Equity Performance from this Phase: S&P 500 flat to +3% from Q1 2004 to July 2004 (volatile, two 5-7% corrections); then +10% in H2 2004. Value outperformed growth; tech underperformed. This analog would imply a consolidation/stalling phase rather than continued sharp advance — the least bullish of the three analogs.
Analog Invalidity Conditions
• Primary analog (1991 Gulf War) breaks if: (1) Trump rejects or delays signing the Hormuz MOU; (2) Iran resumes mining/blockade activities; (3) oil re-spikes above prior highs; or (4) PCE inflation reaccelerates despite oil falling (indicating embedded core/services inflation). In these scenarios, the regime would shift toward the 2022 stagflationary bear or 2018 tightening-driven correction analog.
• Secondary Analog 1 (2023/24 AI boom) breaks if: AI earnings cycle disappoints (revenue growth fails to justify capex); semiconductor inventory builds; Warsh surprises with rate hike or aggressive balance sheet reduction. This would shift toward the 2000 tech bubble correction analog.
Regime Context - Comparison to Prior Weeks
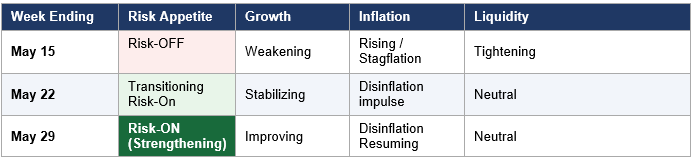
• Regime evolution: The three-week arc describes a complete V-shaped reversal. Week ending May 15 was the nadir of the stagflation shock (CPI 3.8%, oil at cycle highs, VIX 18.43, bearish defensive rotation). Week ending May 22 was the transition (oil retreating, breadth broadening, VIX compressing). Week ending May 29 is the confirmation of an evolving risk-on regime.
• Speed of reversal is notable: Moving from “Risk-OFF / Growth Weakening / Inflation Rising / Liquidity Tightening” to “Risk-ON / Growth Improving / Disinflation / Neutral” in exactly two weeks is exceptionally fast. This either reflects (a) the market correctly identifying the Iran deal as genuinely regime-changing, or (b) the market front-running a deal that is not yet formally signed — creating a vulnerability if the deal stalls.
• Multi-week trends: VIX declining for 3 consecutive weeks; oil declining for 3 consecutive weeks; TLT rising for 2 consecutive weeks; VLUE rising for 2 consecutive weeks with acceleration. These are persistent trends, not one-week anomalies. Trend persistence argues for regime stability.
• Persistent from prior weeks: Iran/Hormuz as the primary unresolved variable; elevated Treasury yields (10Y ~4.44% — lower but not low); Kevin Warsh Fed Chair policy uncertainty; gold maintaining elevated levels suggesting macro tail awareness; record Q1 earnings backdrop.
• New vs. prior week: 9th consecutive weekly gain achieved; US-Iran MOU framework reached (critical new information); 10Y yield -11bps (first meaningful decline in several weeks); VLUE surging to 2-week total of +10.21%; defensive selloff sharpening (XLP -2.22% vs +0.19% prior week).
All comments or feedback appreciated on this report format.
Remember to pre-register for the Inferent Analyst launch later in the year in order to receive foundation subscriber benefits!


Andy West
The Inferential Investor