

Inferent Equity Risk Regime Monitor: Nasdaq Bloodbath Edition - detailed analysis.
What are the market internals telling us about last week's sell-off?
The following report was generated with the Equity Risk Regime research workflow from the INFERENTIAL INVESTOR.
Important Disclaimer: This analysis is subject to The Inferential Investor’s Disclaimer. It is for informational and educational purposes only and does not constitute investment advice, a recommendation to buy or sell any security, an offer or solicitation, or a guarantee of future performance. The information is derived from sources believed to be reliable but no representation or warranty is made as to its accuracy or completeness. Scenario descriptions are not forecasts but explorations of the implications of a set of described conditions and are subjetc to risk and uncertainty. Past performance is not indicative of future results. Readers should consult their own advisers before making any investment decision. AI can make mistakes.
Weekly Market Risk Regime Analysis
7th June 2026
Author’s Note: I don’t think many people had an $85bn Google equity raise (first time in 20+ years), Broadcom revenue guidance miss and blowout jobs report spiking yields, on their dance card for last week. But that’s what the market delivered, and as the report for this week shows, with concentrated positioning and a wall of equity supply now squarely in the sights of institutions (and still building on expectations that all the hyperscalers, eg Meta, may now have to now compete for more $ to avoid falling behind), plus stretched AI valuations after the recent surge, we face a period where multiples are coming under pressure…The evidence from the relative movements in stock and ETF prices last week present a really informative picture of this dynamic. This is one week where its really worth going through all the detail in the report to understand whats behind the moves and the underpinnings of each scenario.
Executive Summary
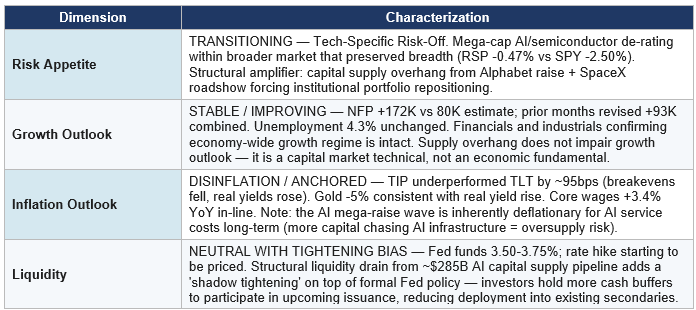
• Risk Regime: TRANSITIONING AGAIN — Tech-specific risk-off within a broader market that largely preserved breadth. The selloff was concentrated in mega-cap AI/semiconductor names. A $285B+ and rising AI capital supply overhang started to be felt..
• Initial catalyst: Broadcom Q2 FY2026 earnings (June 3). Beat headline numbers ($22.2B revenue, $2.44 EPS vs $2.39 est) but held FY2026 AI chip guidance flat; Q3 AI chip sales $16.0B vs $17.2B consensus. Stock fell -12.6%, cascading across the semiconductor complex.
• Supply catalyst: A $285B+ AI capital supply pipeline is materializing and growing in real time that colors the next 6 months. Alphabet priced a $30B public equity offering the week of June 1 (as part of an $80bn staggered raise that was upsized to $85bn). SpaceX’s $75B IPO roadshow — the largest in history — started Thursday June 4. These events forced institutional portfolio repositioning that amplified the selloff.
• Late week catalyst: May NFP +172K vs 80K consensus (2x expectations); prior months revised +93K. 10Y yield spiked to 4.54% on Friday; the market stated to price in a rate hike by December with the policy sensitive 2 year yields up 13 bp to 4.15%.
• Capital supply pipeline: Alphabet ($84.75B total raise), SpaceX (~$75B, pricing ~June 11), OpenAI (~$70B, end 2026 / early 2027), Anthropic (~$60B, Q4 2026). Total: ~$285B concentrated in 6 months — 10x the prior IPO record (Saudi Aramco, $29.4B, 2019) and representing a rolling supply overhang through year-end.
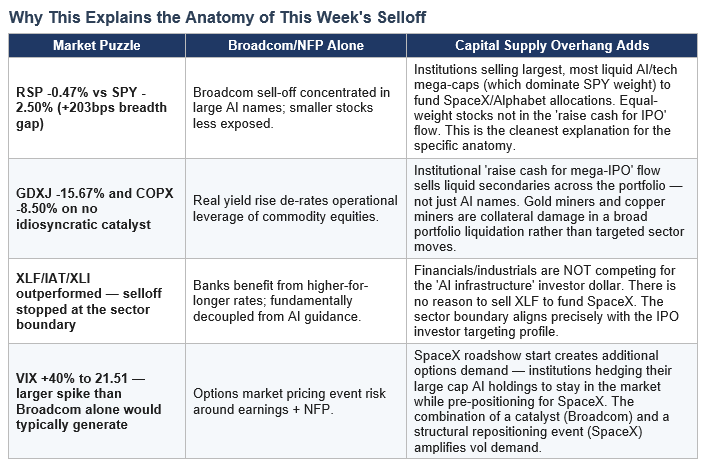
• Equal-weight RSP -0.47% outperformed SPY -2.50% (+203bps breadth gap): This shows that institutions are liquidating largest, most liquid AI/tech mega-cap positions (which dominate cap-weight SPY but not equal-weight RSP) to fund SpaceX and Alphabet allocations. Broadcom gave them a reason; SpaceX / Alphabet raise gave them a catalyst.
• Gold miners (GDXJ) -15.67% and Copper Miners (COPX) -8.50% fell without idiosyncratic news: Commodity miners equities are likely collateral damage in a broad portfolio liquidation — sold as liquid secondaries to generate cash for mega-IPO allocations. Real yield rise adds, but does not fully explain, the magnitude.
• The selloff stopped precisely at financials / industrials: These sectors are NOT competing for the ‘AI infrastructure’ investor dollar. There is no reason to sell XLF or XLI to fund a SpaceX or OpenAI allocation — making the sector boundary functionally diagnostic. If this same dynamic holds over potentially more net selling days, it highlights the liquidity driven catalyst and may indicate a shallower trough.
• Fixed income: TIP -1.75% vs TLT -0.80% — breakeven inflation fell, real yields rose. The blow out jobs numbers on Friday forced the market to consider the potential for rate hikes. Higher real yields pressure equities, multiples and other risk assets. With lack of traction on Iran negotiations, there is an ever-present risk of further oil price spikes and more rate hike impact on the market.
• Liquidity dimension upgraded: The supply overhang creates a ‘shadow tightening’ — investors hold larger cash buffers to participate in upcoming issuance, reducing deployment into existing secondaries — on top of the formal Fed on-hold stance.
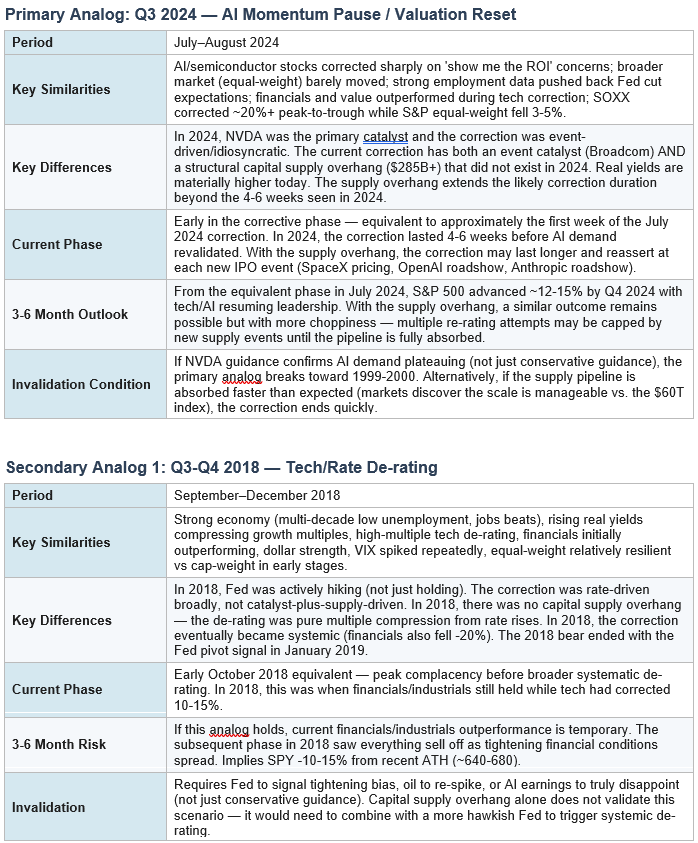
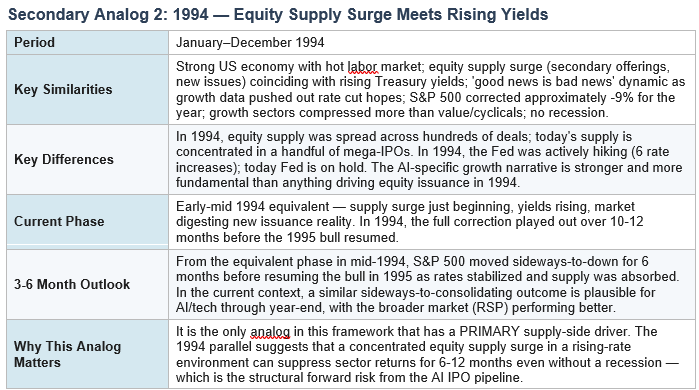
• Primary economic distance analog: Q3 2024 AI Momentum Pause / Valuation Reset with a 1994 supply-surge overlay. The 2024 analog captures the AI guidance correction; the 1994 analog captures the supply surge + rising yields dynamic.
• The size of the impending IPO / Capital Raising supply overhang raises the potential for equity multiple pressure to continue in episodic events as raises are sized and institutions have to plan cash levels.
• Bear counterargument (Yardeni): $200B is 0.33% of the $60T S&P 500 and the market trade $1 tr per day in volume; IPO supply is net positive for AI market legitimacy; Berkshire $10B investment in Alphabet is a structural confidence signal. New IPO index inclusions will force passive inflows into those names on listing. These are valid offsets — but they primarily benefit the new names at the expense of the existing AI/semi complex.
4-Dimension Regime Determination

Before we continue, let me introduce you to Inferent Analyst. This is the state-of-the-art AI investment research analyst platform being developed right now. Inferent Analyst is designed to be your agentic equity research assistant. No more pages and pages of raw numbers without context, like traditional data terminals. Inferent Analyst actually interprets and analyzes the data automatically, as events unfold, to help you discover more ideas and make better investment decisions. Pre-register today for early access benefits.
Equity Market Implications: Scenario Outlines
The following are scenario descriptions, not forecasts and are designed to explore the implications for the market and its internals of a set of conditions that are plausible based on the evolving evidence. Evidence this week has shifted up the probability of the alternative scenario while still supporting the primary scenario at a reduced probability.
Primary Scenario: AI Valuation Reset + Supply Absorption Within Intact Medium Term Bull Market
• This scenario would be consistent with: AI/semiconductor stocks consolidating for a longer period (6-12 weeks rather than 2-4) as the market absorbs Broadcom guidance disappointment AND the SpaceX/OpenAI/Anthropic supply pipeline; broader market (RSP) holds or gains modestly; each major IPO event creates a temporary selloff in existing AI names followed by partial recovery; the bull market for non-AI sectors remains intact.
• Index-level outlook: Technicals (RSI, MACD, divergences, OBV) across SPY and QQQ are weakening. SPY could test prior ATH region in the near term. Further supply events (OpenAI roadshow, Anthropic roadshow, potential new equity raise announcements from hyperscalers racing to beat the IPO wave) may create additional tests of this support through Q3-Q4 2026. QQQ presents most risk given AI/semi concentration. SMH is at the center of the selling pressure.
• Sectors that may outperform under this scenario: Financials (XLF, IAT) benefiting from higher-for-longer and strong loan demand; Healthcare (IHF) providing earnings certainty and defensive positioning; Industrials (XLI) benefiting from AI infrastructure buildout (copper, power, construction demand) while insulated from AI equity re-rating; Equal-weight (RSP) outperforming cap-weight until supply overhang resolves.
• Factor positioning: Quality (QUAL) for resilient non-AI earnings; short-duration Value (VLUE) for rate-resistant cash flows; USMV with caveat that real yield rise removes some bond-proxy benefit.
• Key catalysts to watch: (1) SpaceX pricing (~June 11) — post-pricing bounce likely in AI/semi as positioning uncertainty resolves; (2) NVDA earnings — critical AI demand re-validation event; (3) OpenAI IPO pre-marketing (August/September) — the next major supply-driven pressure event; (4) Iran MOU signing — would release oil’s geopolitical premium, adding a macro disinflationary tailwind.
• Upside scenario within primary: If chipmakers outlook commentary remains strong AND SpaceX IPO trades well (validating market’s capacity to absorb mega-AI supply), existing AI names could bounce sharply in a ‘rising tide lifts all AI boats’ dynamic. The 10-week winning streak likely resumes, but at a lower multiple ceiling than before the supply wave began.
Alternative Scenario: AI Demand Ceiling + Supply Overhang Creates Systemic De-rating
• What would drive this scenario: Broadcom’s guidance proves to be genuine demand signaling (not sandbagging) — which would have to be confirmed by NVDA guidance disappointment in August; hyperscalers cut or defer AI capex despite having already raised capital (still low probability); SpaceX IPO trades poorly post-listing (validating market concerns about absorptive capacity); oil re-spikes on Iran deal collapse; or Warsh introduces unexpected hawkish language.
• The supply overhang amplifies this scenario: In a pure Broadcom-only thesis, the market might absorb a correction in AI/semis quickly. But with $285B in supply competing for the same investor dollar over 6 months, any demand-side weakness has a structural amplifier. The ceiling on AI/SMH/QQQ recovery attempts is implied in the IPO calendar.
• Market implications: SPY/QQQ could test moving averages which stil lie far below current levels after the recent surge. Forward P/E would compress from ~21x toward 19x (its recent sell-off trough). The AI narrative faces its most significant challenge since the 2022 growth selloff. Unlike 2022 (Fed tightening + earnings collapse), this scenario would be about multiple compression from supply + demand ceiling — not fundamental earnings destruction.
• Sector behavior: Financials initially continue outperforming, but ultimately face headwinds as broader financial conditions tighten; defensives (IHF, XLP) become primary refuge; energy could spike on Iran deal collapse; small caps (IWM) would likely underperform as credit risk reprices.
• Factor behavior: Quality (QUAL) and Min-Vol (USMV) lead; Growth (VUG) and Momentum (MTUM) underperform significantly; Value (VLUE) performs relatively better but is not immune to broad de-rating.
• Probability of this scenario has risen compared with the prior week specifically because the capital supply overhang is now confirmed as a real structural variable and Google’s surprise raise and Meta rumors in news articles increase its magnitude. The SpaceX IPO is pricing next week. The OpenAI and Anthropic pipelines are publicly announced. Whether the market can absorb $285B in concentrated AI supply while existing AI/semi multiples hold is an open empirical question.
Newsflow Review
Themes Emergent or Intensified in Most Recent Week (June 6)
• Broadcom AI guidance disappointment: Beat Q2 headline numbers but held FY2026 AI chip guidance flat; Q3 AI chip sales guidance ($16.0B) missed $17.2B consensus. AVGO -12.6%, cascading globally (Kospi -5.54%, Samsung -6.4%, SK Hynix -9.9%).
• ‘Good news is bad news’ jobs dynamic: NFP +172K (2x consensus) pushed 10Y to 4.54%; rate cut expectations to H2 2026/Q1 2027. Average hourly earnings +3.4% YoY in-line.
• NEW — Alphabet $84.75B equity raise: The largest equity raise in tech history. $30B public component priced the week of June 1. Berkshire Hathaway invested $10B privately. $40B ATM program to begin Q3. This absorbed institutional cash and established a precedent for other hyperscalers to issue equity at scale.
• NEW — SpaceX $75B IPO roadshow commenced Thursday June 4: Targeting $135/share, $1.77T valuation; pricing ~June 11. Goldman Sachs leading 21-bank syndicate. Largest IPO in history (2.5x Saudi Aramco). Institutional pre-positioning began this week.
• Gold and commodity equity de-rating: GLD -5.00%, GDXJ -15.67%, COPX -8.50% — driven by rising real yields (TIP underperforming TLT) plus capital supply portfolio repositioning.
• Defensive rotation into healthcare: IHF +3.36% — the strongest defensive sector; earnings certainty in non-AI sectors sought by equity investors.
Themes Fading in Most Recent Week (June 6)
• Momentum factor leadership: MTUM -2.95% after +4.02% prior week — momentum reversal consistent with sharp sector rotation.
• Value factor outperformance: VLUE -3.12% after +5.76% prior week — mean reversion after the large surge.
• Disinflationary tailwind from oil: USO bounced +3.05% as Iran deal delay partially restored geopolitical risk premium to crude.
Capital Supply Overhang
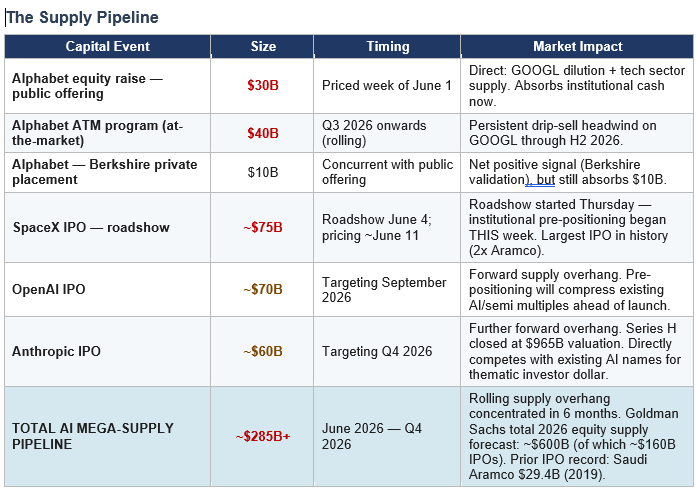
• Context: Goldman Sachs indicates ~$1.2Tr in total US equity supply is possible this year. The three mega-AI IPOs alone represent ~$205B+ — exceeding the entire prior-year IPO market and concentrated in a six-month window.
• The Alphabet raise is also notable: the company has already raised $85B+ in debt across six currencies over the prior year (including a 100-year bond), bringing total debt to $100B+. This equity raise adds to a dual demand on both equity and fixed-income investors for AI infrastructure capital and raises pressure on competitors to follow suit.
• Hyperscaler context: Combined Big Tech capex for 2026 is ~$725B (Google $180-190B, Amazon $200B, Microsoft $190B, Meta $115-135B). The capital raise wave has only just started and is now clearly the next funding mechanism for this spending — existing cash flows are insufficient, hence the equity issuance. Meta has denied the rumors but is clearly a likely next equity raising candidate and shorts will be expected to build on this.
The ‘Competitive Cannibalism’ Mechanism
• Each mega-AI IPO competes directly for the same ‘AI infrastructure’ investor dollar as existing public AI companies. An investor choosing between SpaceX (new) and NVDA (existing) in a fixed allocation framework must reduce NVDA to fund SpaceX.
• Passive index effect (post-listing): Once SpaceX/OpenAI/Anthropic are included in the S&P 500, passive ETFs (SPY, QQQ equivalents) will automatically buy them. But before listing, these names don’t exist in passive portfolios. Active managers are therefore pre-positioning by reducing existing AI/semi exposure NOW in anticipation of index-forced rebalancing LATER.
• Sector-specific impact vs. broad market: The critical feature is that this cannibalism is contained to the AI/infrastructure investor segment. Financials, healthcare, and industrials are NOT in the same thematic basket — explaining why RSP (which includes these sectors equally) held firm while SPY (mega-cap AI concentrated) sold off.
Forward Supply Calendar Implications
• Near-term (2 weeks): SpaceX pricing ~June 11 — peak pre-allocation pressure likely this week and next. Post-pricing, uncertainty resolves and some selling pressure lifts. Watch for a bounce in AI/semi names once SpaceX is priced, similar to how markets bounce after a large secondary offering digest.
• Short-term (6-8 weeks): Alphabet’s $40B ATM program begins Q3 — a persistent, rolling drip-sell headwind on GOOGL specifically and sector sentiment broadly.
• Medium-term (Q3 2026): OpenAI IPO targeting September creates another major pre-positioning event. Expect a version of this week’s dynamics to re-emerge 3-4 weeks before the roadshow — existing AI/semi sell-off as institutions pre-position.
• Medium-term (Q4 2026): Anthropic IPO creates a third event. By this point, the market will have been absorbing AI mega-supply for over 6 consecutive months.
• Structural cap on AI/tech multiple expansion: Even if AI earnings beats continue (NVDA, AMD, hyperscalers), the sector’s ability to re-rate above current ~21x forward P/E is constrained by the sheer volume of competing supply. Revenue growth may be priced at lower multiples through H2 2026 even in a bull case.
The Bull Counterargument
• Yardeni Research argues that fears SpaceX/OpenAI/Anthropic IPOs will ‘suck oxygen’ from markets are overblown: $200B is 0.33% of the $60T Wilshire 5000 and $60T S&P 500. Total avg daily trading value across NYSE and NASDAQ is approximately US$1tr. This suggests liquidity effects appear only to the extent there is coordinated selling in discrete (concentrated) moments.
• Berkshire Hathaway’s $10B investment in Alphabet at IPO price is a structural confidence signal from one of the most patient capital allocators in history — and may encourage other long-term holders to add rather than reduce.
• New index inclusions post-listing will force passive inflows: When SpaceX joins the S&P 500, ~$500B+ in passive ETF assets will buy it automatically. This recycling may partially offset the pre-IPO selling.
• The IPO wave legitimizes AI spending: If SpaceX and OpenAI successfully raise $70-75B each, it confirms investor appetite for AI infrastructure at scale — a positive signal for the sector’s long-term earnings growth trajectory.
Assessment: The bull counterargument is valid but primarily benefits the NEW names (SpaceX, OpenAI, Anthropic) rather than the existing AI/semi complex (NVDA, AMD, Broadcom, ASML). Net effect for existing holders is negative in the near/medium term even if the structural AI thesis is intact.
Cross-Asset Risk Regime Analysis
Macro-Sensitive Assets
• Gold (GLD -5.00%): Driven by real yield rise (TIP underperformed TLT) and portfolio cash-raising for IPO allocations. Not a flight-to-safety week — gold fell alongside selective equity selling.
• Copper (CPER -1.98%, COPX -8.50%): Physical copper modest; copper equities collapsed via operational leverage de-rating + portfolio-level cash-raising selling.
• Commodities (DBC -0.81%, XLB -1.00%): Soft excluding oil — consistent with modest global growth uncertainty but no recession pricing.
• Oil (USO +3.05%): Partial reversal of prior -8.39%. Iran deal unsigned; clashes continue — geopolitical risk premium partially restored.
• Treasuries: TLT -0.80%, SHV -0.23% — long end sold on hot NFP; bear-flattened mildly. No duration flight consistent with no growth scare. Alphabet’s $85B+ in prior-year debt issuance demonstrates bond market is also being asked to absorb AI infrastructure financing at scale.
• Dollar (UUP +0.62%): Strengthened on hot NFP — ‘higher for longer’ rate differential. Structural note: large-scale US equity issuance (Google, SpaceX) may attract foreign capital inflows that support USD at the margin.
Risk Barometers
• Flight-to-safety: ABSENT at this stage. Gold fell; TLT sold off; dollar strengthened on growth. NOT a macro risk-off event - more a higher rea;l yield plus supply repricing.
• Risk-on/off: SECTOR ROTATION within equities, not FROM equities. Financials, industrials, healthcare positive; AI/semis/growth tech negative.
• Volatility: VIX +40.40% to 21.51. Elevated but not panic. Options market pricing: (1) Broadcom event risk read through to other names; (2) SpaceX roadshow hedge demand (institutions hedging large AI holdings while pre-positioning for IPO); (3) NFP rate shock. The combination of all three is a VIX amplifier beyond what any single catalyst would produce.
• Breadth: RSP -0.47% vs SPY -2.50% = +203bps. Breadth preserved. Capital supply overhang explains the specific anatomy.
Inflation vs Growth Dynamics
Inflation Expectations
• TIP vs TLT (-1.75% vs -0.80%): Breakeven inflation fell ~95bps — market pricing less future CPI. Disinflationary, not stagflationary. The inverse of the May 15 shock.
• Real yields rose: Higher real yields are bearish for (1) gold and non-yielding assets — confirmed by GLD -5%; (2) high-multiple growth equities — confirmed by QQQ -4.5%; (3) commodity equity companies — confirmed by COPX -8.5%, GDXJ -15.7%.
• Long-run structural point: The AI mega-raise wave is itself structurally disinflationary. ~$285B in AI infrastructure investment (plus hyperscaler capex of $725B) will produce massive AI capacity additions over 2026-2028. Excess AI compute supply historically drives AI service cost deflation (cf. cloud pricing 2012-2020). The capital raises accelerate this dynamic.
Growth Repricing
• NFP +172K (2x consensus): Strongest growth signal of the week. Labor market not softening. Unemployment 4.3% unchanged. This does NOT support a growth scare narrative.
• Cyclicals confirming growth: XLI +0.61%, XLF +1.41%, IAT +2.09% — consistent with ‘strong economy / sector rotation’ not economic slowdown.
• Supply overhang note: The capital raise wave is being funded partly by operational cash flows and partly by capital markets. The $725B hyperscaler capex is an enormous boost to industrial/infrastructure supply chains (construction, cooling systems, copper, power) — supporting IXI and related industrials at the macro level even as the AI equity complex de-rates.
• Conclusion: Economic backdrop remains broadly supportive. Current market weakness is a VALUATION AND CAPITAL SUPPLY correction in the highest-multiple sector, occurring WITHIN a resilient economic environment.
Sector Rotation & Factor Signals
Two-week performance with prior week for context. Supply overhang dimension noted in regime signal column.
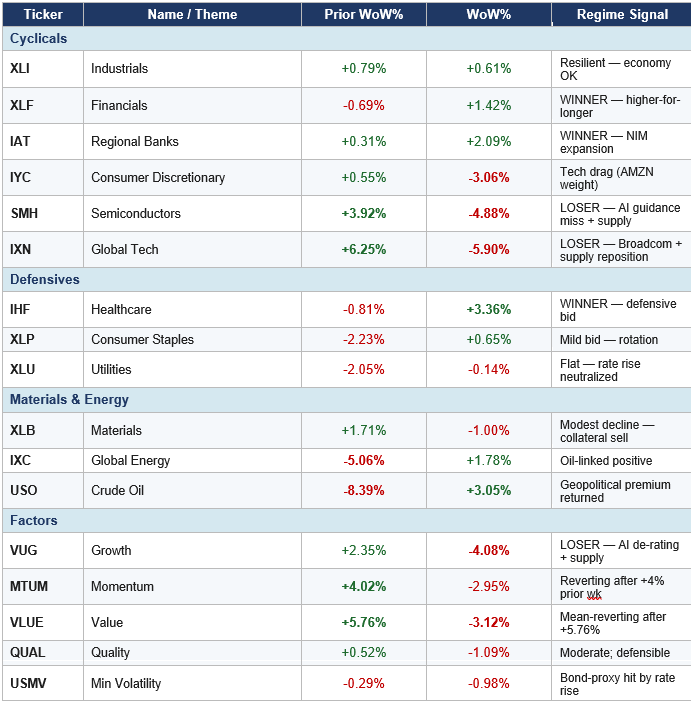
• The capital supply overhang thesis provides a structural explanation for WHY the rotation is concentrated as it is. Sectors competing for the ‘AI infrastructure’ investor dollar (IXN, SMH, COPX, GDXJ, VUG,
MTUM) are underperforming. Sectors outside this universe (XLF, IAT, IHF, XLI) are outperforming.
• This sector boundary is not Broadcom-specific — it maps precisely onto the investor targeting profile of SpaceX, OpenAI, and Anthropic. AI-theme investors must reduce exposure to fund new allocations; value/cyclical investors have no such pressure.
• Factor regime: VUG (growth) and MTUM (momentum) are the primary losers. These are the factors most associated with AI/tech exposure. QUAL and USMV underperformed their defensive reputation because real yield rise removed their bond-proxy premium. The factor that should outperform in the supply overhang environment is VLUE (value) — though it is mean-reverting after a large prior week.
Economic Distance Analogs
Pre-registrations to Inferent Analyst will get early access. Reserve your spot now.

All comments or feedback appreciated on this report format.
Andy West
The Inferential Investor

Very informative. Thank you for sharing !!