

In 2026, Markets Face a "Three Body Problem": Tariffs, the Fed and Midterms
a Scenario Based Market Outlook

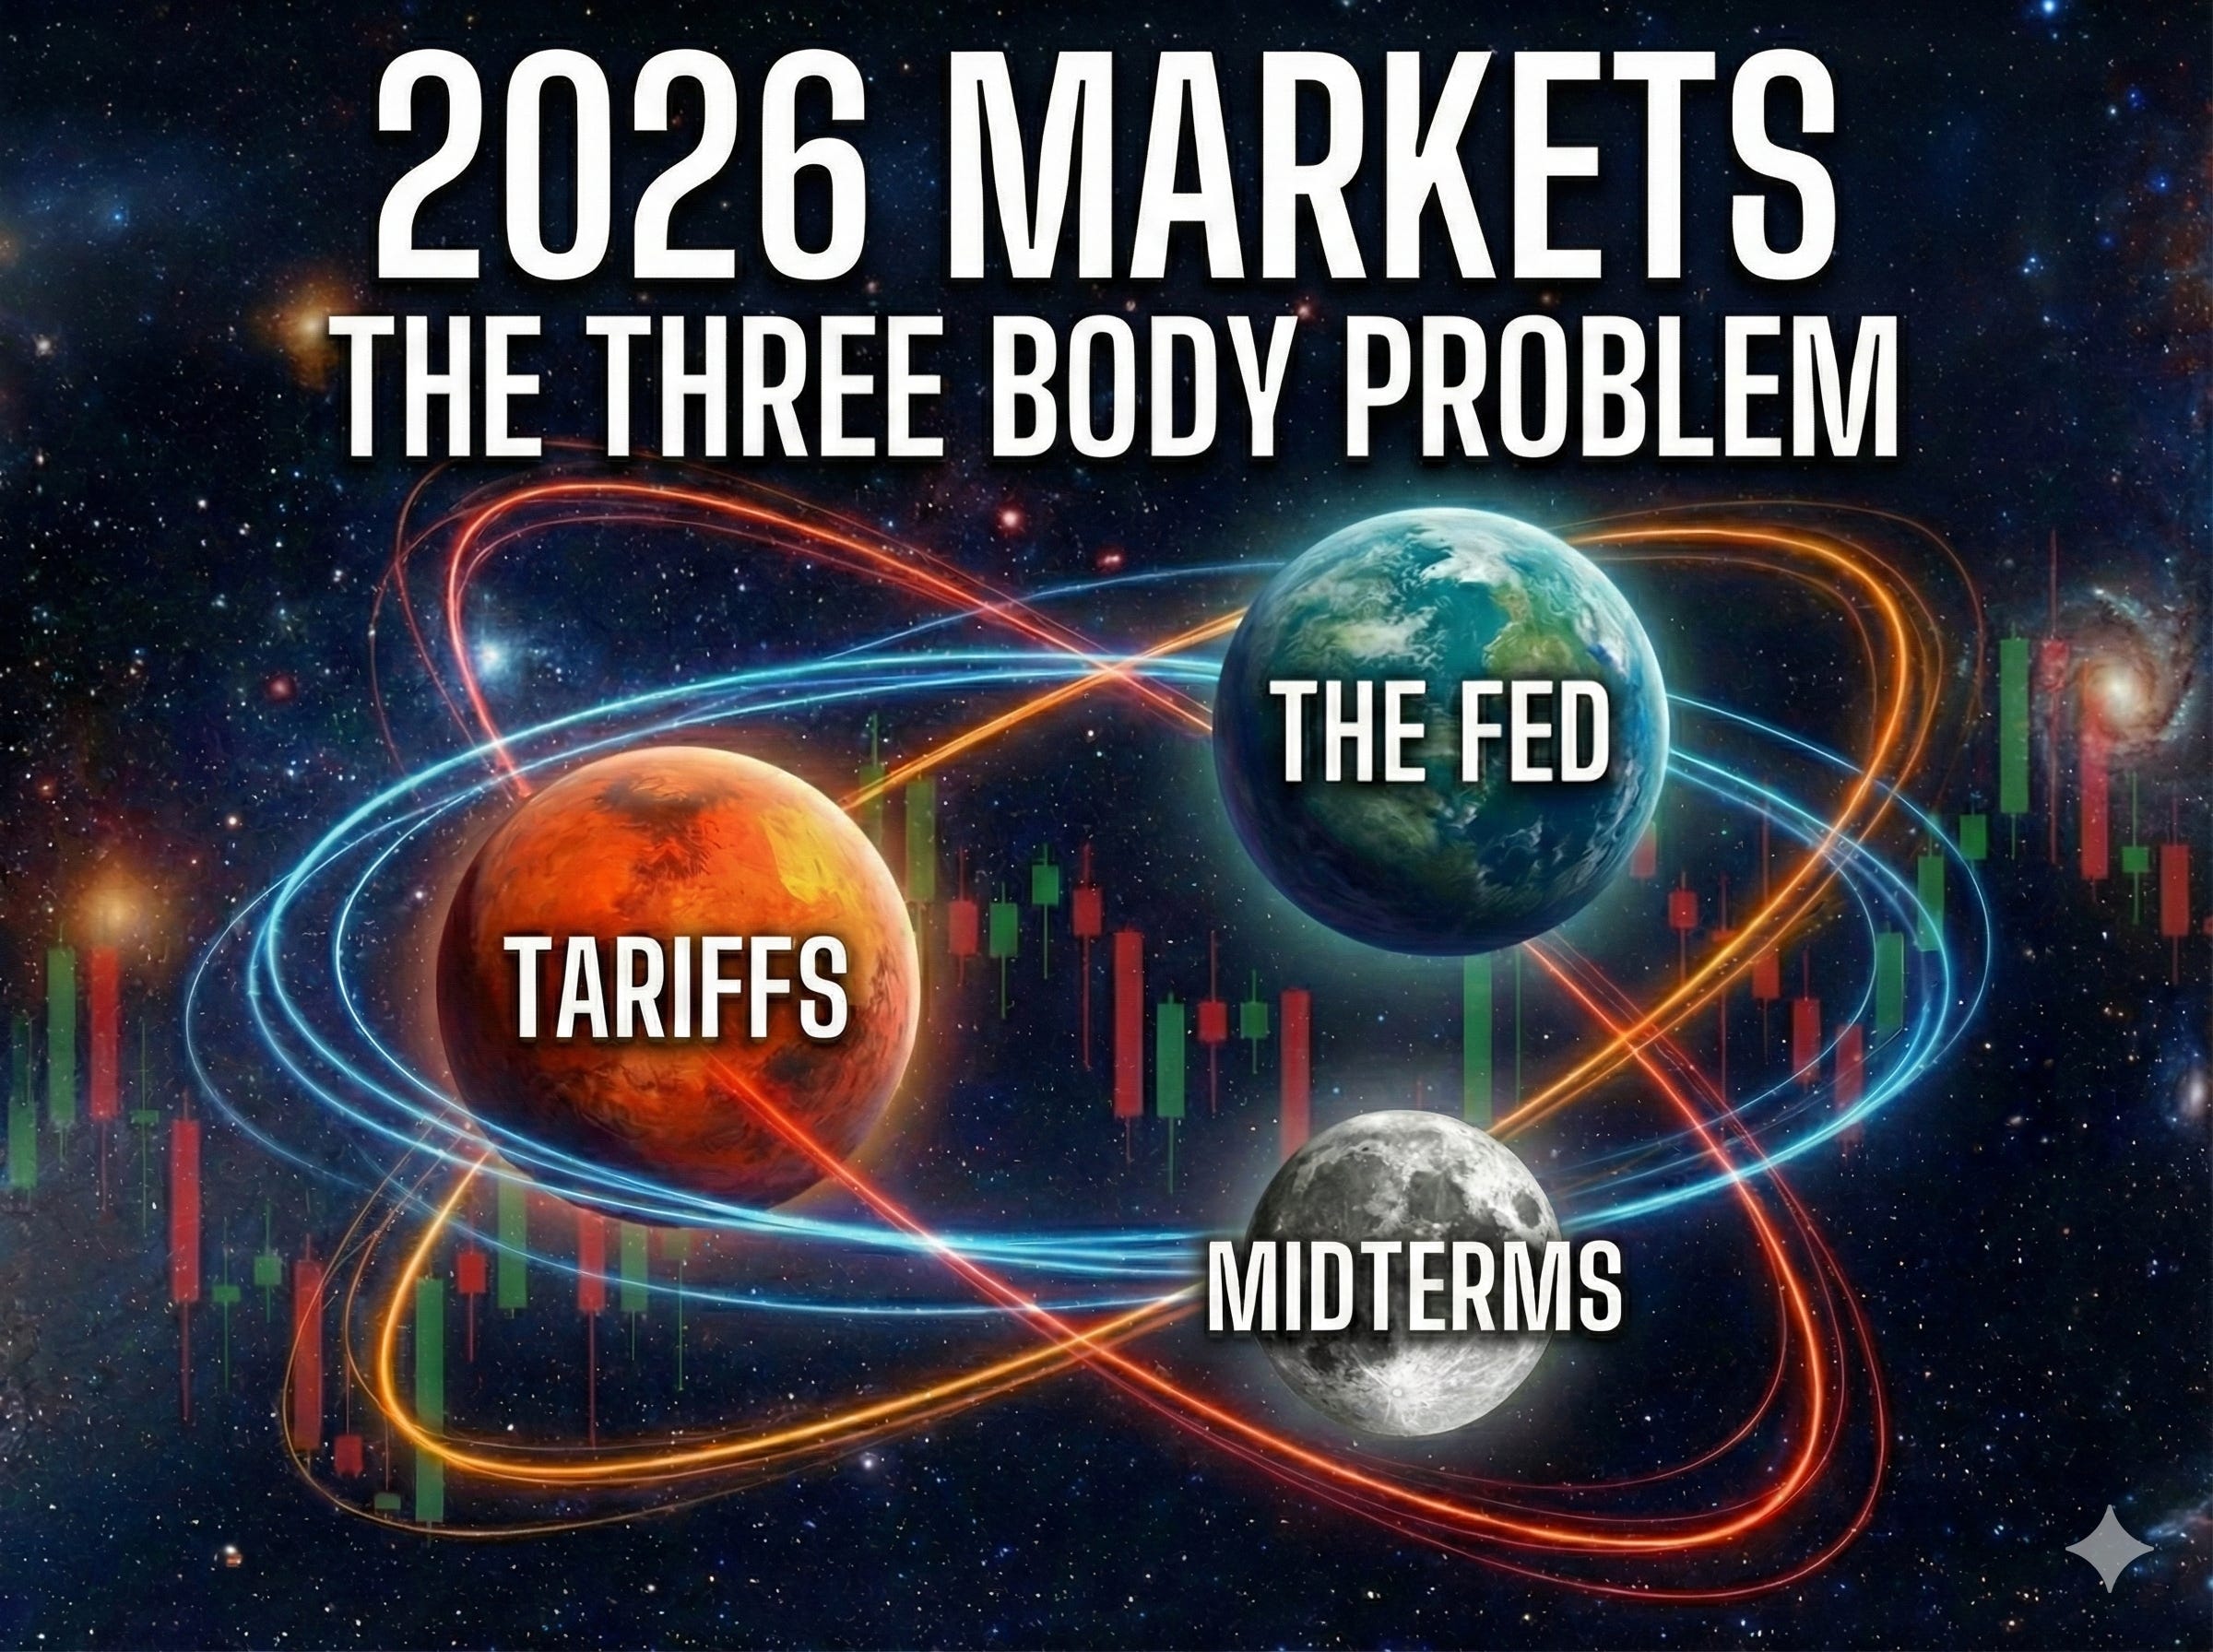
In physics, if you have two celestial bodies (like Earth and the Moon), you can predict their movement. However, the moment you introduce a third body of comparable mass, the system becomes chaotic. No general formula can predict their future positions; you can only continually re-simulate it, moment by moment.
In 2026, US (and by extension, global) markets face their own three body problem driven by three major uncertainties:
Will tariffs be upheld or struck down imminently by the Supreme Court with implications for inflation, rates and all asset classes.
Who will be the new Fed chair and what will this signal for the rate path, inflation risks and the Fed’s independence. Again this decision has implications across asset classes.
What will happen leading up to and in the November midterms? Will fiscal policies to buy votes fuel inflation and will control of Congress change, become gridlocked or stay with the status quo?
The magnitude of these uncertainties make 2026 appear less like a continuous path and more like a series of binary forks in the road. Markets are currently suspended in a state of fragile optimism, with the S&P 500 hovering near all-time highs and valuations stretched to the 95th percentile of historical averages. Yet that optimism rests on a narrow set of assumptions: that policy uncertainty does not intensify, that inflation continues to glide lower without a growth shock, and that fiscal dynamics remain manageable. That path looks very narrow in 2026.
The economic backdrop is complex too. We enter 2026 with a US economy that is nominally robust but fiscally bloated. The deficit remains wide, labor markets are deteriorating, inflation has proven stickier than the Federal Reserve’s 2% target would prefer, and corporate margins outside technology are under pressure from rising input costs. Into this delicate equilibrium, these three idiosyncratic shocks of Tariffs, the Fed and Midterms (“TFM”) are set to collide. The interactions between legal rulings on trade, the politicization of monetary policy, and the unique fiscal dynamics of the upcoming midterm election cycle will determine whether 2026 becomes a year of renewed prosperity or a stagflationary trap.
These colliding forces likely make 2026 a year that broker year-end index targets are even less accurate than usual.
1. Tariffs: The Supreme Court Decision and a $100 Billion Question Mark
The first, and perhaps most immediate, pivot point for the 2026 outlook lies not on Wall Street, but at First Street NE in Washington, D.C. The Supreme Court’s impending decision in V.O.S. Selections, Inc. v. Trump (consolidated with Learning Resources v. Trump) represents a binary risk event. At stake is the executive branch’s authority to use the International Emergency Economic Powers Act (IEEPA) to impose tariffs without explicit Congressional approval.
The Core Issue, Decision & Timing
Following expedited oral arguments on November 5, 2025 due to the “national emergency” nature of the economic impact, a decision is expected imminently. This could well be during the Court’s winter recess in late December or early January. This ruling will serve as the “starting gun” for the 2026 trade (and markets) narrative.
The Court must decide if IEEPA’s grant of authority to “regulate” international commerce during a national emergency includes the power to impose new tariffs (taxes) that Congress did not explicitly authorize.
The Lower Court Ruling: The Federal Circuit (in August 2025) ruled AGAINST the Administration, stating that “regulating” does not mean “taxing.”
The Stakes: If the Supreme Court affirms the lower court, the “Reciprocal Tariffs” (10-20% universal) and “Trafficking Tariffs” (China/Mexico/Canada) could be instantly voided.
Scenario A: Court Strikes Down the Tariffs (The “Relief” Outcome)
Probability: Moderate-High. (Legal experts noted the conservative Justices appeared skeptical of the “unlimited taxing power” argument during the Nov 5 hearings).
Market Reaction:
Stocks: Positive Implications. Retailers (Target, Walmart, CostCo), Consumer Discretionary (Apple, Nike, Apparel Brands, E-commerce stocks), Auto Manufacturers, and Industrials would be beneficiaries as their input costs collapse.
Inflation: Immediate downward revision in 2026 inflation forecasts.
The “Pivot” Risk: The rally might be capped by the knowledge that President Trump will simply re-impose the tariffs using a different law (e.g., Section 301 or Section 122 “Balance of Payments” authority), though that process takes time.
Scenario B: Court Upholds the Tariffs (The “Stagflation” Outcome)
Probability: Low-Moderate. (Relies on the Court deferring entirely to Executive national security judgment). This would be a negative surprise to markets given the lower court ruling already.
Market Reaction:
Stocks: Sell-off. Markets would have to price in the tariffs as permanent, reinforcing margin pressures for the non-technology S&P 500 core.
Bonds: Yields would likely spike (prices fall) as inflation expectations become entrenched.
Winners: Domestic small-caps (Russell 2000) might outperform multinationals, but the overall index would potentially suffer.
Materiality: Why this matters now
This decision is material because it influences the Federal Reserve’s next move.
If the tariffs are voided in January, the Fed has a clearer path to cut rates in 2026.
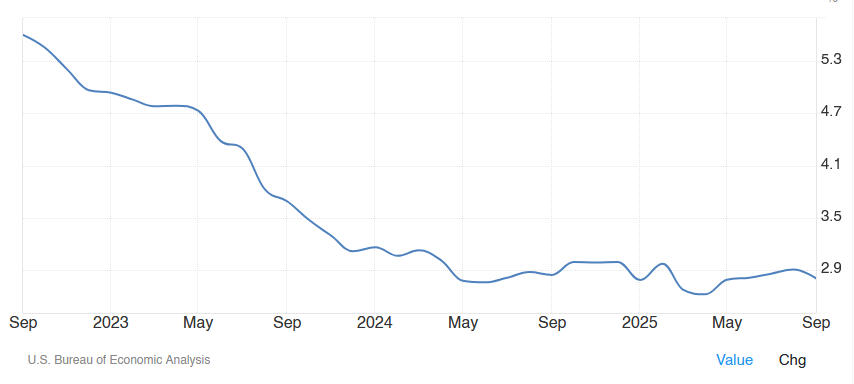
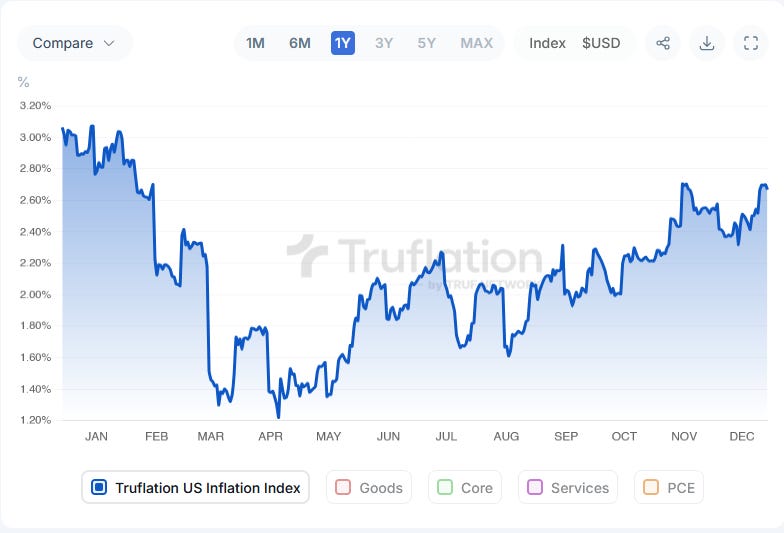
If the tariffs stand, the Fed (especially if Powell is still Chair until May) may face a rebound in inflation such as some other economies are facing, that shifts the market towards renewed rate hike fears. It will only take one poor inflationary print to do that as we’ve seen elsewhere. With the government shutdown, the market has been operating in an inflation information void for some time. An uptick would be a poorly received negative surprise.
US Core PCE Inflation (YoY): The last print was for September showing inflation flat.
However, Truflation which correlates over time with the general inflationary trend has been rising since the last official print pre-shutdown
The “Refund” Windfall
A critical, underappreciated aspect of a potential anti-tariff ruling is the mechanism of retroactive refunds. If the tariffs are declared unlawful, the U.S. Treasury may be liable to refund billions in collected duties plus interest, to companies that filed timely protective suits in the Court of International Trade (CIT). Some have estimated this at even $100bn.
This is not a theoretical possibility; it is a live docket item. Costco Wholesale (COST) has actively filed suit to preserve its rights, a move that signals the high materiality of the issue given their thin net margins. Other major players, including Tesla (TSLA) and various automotive suppliers, have similar litigation footprints. For these firms, a favorable ruling is not just about future costs; it is a retroactive injection of cash that would flow directly to the bottom line, potentially boosting quarterly EPS by magnitudes rarely seen outside of tax holidays.
2. The Fed: “Two Kevins” and the Battle for Credibility
If the Supreme Court defines the cost of goods, the Federal Reserve Chair determines the price of money. With Jerome Powell’s term as Chair expiring on May 15, 2026, the transition has become a source of profound volatility. The Trump administration is expected to announce its nominee imminently, creating a “Shadow Chair” dynamic for the first half of the year.
This announcement of the successor is expected to happen much sooner than normal, potentially within the next few weeks (late December 2025 or January 2026) according to President Trump’s latest interview.
The Trump administration appears to be using a strategy of announcing a replacement early to effectively make Jerome Powell a “lame duck” for the final five months of his term, signaling to markets that a new low-rate regime is coming.
The Reported Shortlist
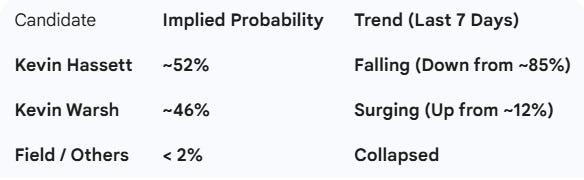
Prediction markets have tightened dramatically in mid-December. Until late last week, Kevin Hassett (current NEC Director) was the overwhelming favorite. The sudden surge for Kevin Warsh appears driven by three specific developments that occurred over the weekend:
The “Oval Office Interview”: Reports leaked that Warsh had a 45-minute private meeting with President Trump on Wednesday (Dec 10), where he reportedly assured the President he is not opposed to lower rates, despite his prior “hawkish” reputation.
The “Dimon Endorsement”: Jamie Dimon (CEO of JPMorgan) reportedly signaled to the White House that Warsh would be viewed by Wall Street as a “credible, steady hand,” whereas Hassett might trigger a bond market revolt.
Trump’s “Two Kevins” Comment: In his Friday interview with the Wall Street Journal, President Trump explicitly named them as the finalists: “I think the two Kevins are great... I have a pretty good idea who I want.” This confirmed Warsh was real competition for Hassett, triggering a massive repricing in the betting markets.
As of this morning (December 15, 2025), here is what the prediction markets (Polymarket and Kalshi) are signaling:
Kevin Hassett (The Loyalist): As the current NEC Director, Hassett represents the path of “Fiscal Dominance”. This entails a Fed that coordinates explicitly with the White House to support growth. While politically expedient, markets view this selection with trepidation. A Hassett nomination risks triggering the “Bond Vigilantes,” who may demand significantly higher yields on the 10-Year Treasury to compensate for a perceived loss of central bank independence.
Asset Reaction: Under Hassett, Gold and Crypto could outperform as hedges against debasement. The U.S. Dollar could face a crisis of confidence, and long-duration Treasuries could sell off aggressively (rising long yields).
Kevin Warsh (The Pragmatist): A former Fed Governor, Warsh is viewed by Wall Street as a credible institutionalist. His recent surge in betting markets, driven by reports of a successful private meeting with the President, suggests a compromise candidate who favors deregulation but respects the currency.
Asset Reaction: A Warsh nomination, endorsed recently by Jamie Dimon, could soothe bond market volatility, anchoring the 10-Year yield and support a rally in traditional Banking and Financial stocks.
The Rate Outlook & The Dollar
The intersection of this appointment with the “Stimulus Paradox” (below) is critical. If the administration pursues inflationary fiscal policy (tariffs + checks) while appointing a dovish Chair (Hassett), the result is a recipe for a 1970s-style inflation spiral. Conversely, a Warsh Fed would likely be viewed as less dovish to offset fiscal expansion.
This creates a bifurcated outlook for the U.S. Dollar. In a scenario where tariffs remain and the Fed is seen as less dovish (Warsh), the Greenback could strengthen, hurting emerging markets and U.S. exporters. However, if the Fed capitulates to fiscal pressure (Hassett), the Dollar’s role as a store of value could be questioned, igniting a rally in real assets.
3. Midterms: The Stimulus Paradox and Echo of 1966
The final pillar of the Three-Body uncertainty is the 2026 Midterm Election. History provides a reliable roadmap for midterm years, but current policy proposals have the ability to drive the markets off-road. First the midterm dynamics:
The next United States midterm elections will be held on Tuesday, November 3, 2026.
Key Offices on the Ballot
U.S. House of Representatives: All 435 voting seats are up for election.
U.S. Senate: 33 of the 100 seats (Class 2) are up for regular election, plus any special elections to fill vacancies.
Gubernatorial: 36 states and 3 territories will hold elections for Governor.
State & Local: Numerous state legislative chambers, mayoralties, and local offices will also be contested.
2026 Election Timeline
Primary Season: Primaries typically begin in March 2026 (e.g., Texas often holds the first primary) and continue through September.
General Election: November 3, 2026.
Inauguration of Winners: The winners of the congressional elections will be sworn into the 120th United States Congress in January 2027.
Whats at Stake: The Historical Cycle
Since World War II, the “Year 2” midterm year has historically been the weakest of the four-year presidential cycle. Average returns on the S&P 500 have been +7.5%-8% which aren’t a disaster, but this is weaker than non midterm years (~+11%) and have a broad dispersion. The problem is uncertainty which markets loathe and as we’ll cover, “the stimulus paradox”.
The pattern is famously V-shaped: a “Pre-Election Grind” characterized by many years showing drawdowns between Jan-Oct and heightened volatility. Average intra-year drawdowns (peak-to-trough declines) have often occurred of around -17% to -19%, which is significantly deeper than in non-election years. This however can be followed by a potential “Post-Election Relief Rally” once the results (usually gridlock) are known and uncertainty recedes. In years this occurs, the market often finds a bottom in September or October just before voters head to the polls.
However, not all midterms are created equal. The data reveals a stark divergence between years of austerity and years of stimulus. Conventional wisdom suggests that government stimulus boosts stocks. Data however, shows that midterm years where the administration aggressively stimulates (often to combat low approval ratings or fear of losing the House) tend to be significantly worse for the stock market than years where the government remains neutral or fiscally restrained.
Here is the breakdown of returns for “High Stimulus” vs. “Non-Stimulatory” midterm years according to Gemini.
The “Stimulus” Midterm Years
Characteristics: These administrations passed significant fiscal expansion (tax cuts, war spending, or social spending) effective in the midterm year to boost the economy or poll numbers.
Result: The market typically choked on the stimulus due to inflation fears and the Federal Reserve hiking rates to counteract the government’s spending. 2002 was different with the US emerging from recession but with persistently weak economic conditions and rising unemployment offsetting lower rates.
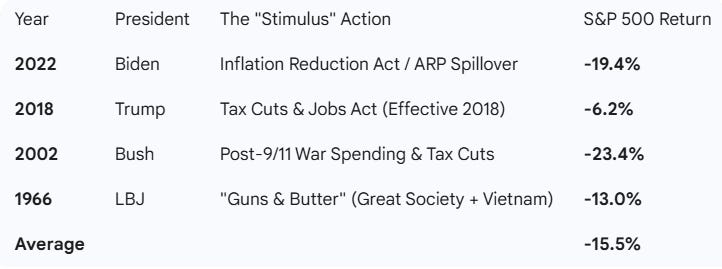
The Pattern: In many modern instances where an administration hit the fiscal gas pedal in a midterm year, the stock market finished negative. In a warning for 2026, the bond market can revolt (yields spike), which can force the Fed to tighten financial conditions, which in turn can crush equity valuations. The market can effectively be sensitive to any signs of political desperation as it signals heightened uncertainty.
The “Non-Stimulatory” (Austerity/Neutral) Midterm Years
Characteristics: These years saw divided government, budget surpluses, spending cuts (sequestration), or a general lack of new fiscal initiatives.
Result: With the government “staying out of the way,” the Fed often remained accommodating, and markets rallied.
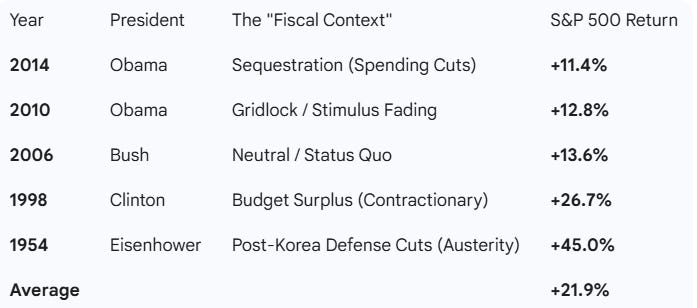
Outliers
The best midterm year in modern history, 1954 (+45%), was driven by a collapse in government spending following the Korean War, which killed inflation and allowed the Fed to keep rates low. Conversely, years like 1966 (-13%) and 2018 (-6%) and 2022 (-19%) shared a common flaw: the administration stimulated the economy when it was already hot or experiencing inflation. This “Stimulus Paradox” forced the Fed to hike rates to counteract government spending, crushing equity valuations.
Will 2026 become a “Bear Trap”?
Regrettably, the signaled policy mix for 2026 holds more parallels with the failures of 1966 and 2018 rather than the success of 1954. The administration’s proposals, specifically the $2,000 “Tariff Dividend” checks and the expansionary “One Big Beautiful Bill Act” (OBBBA) are, in part, designed to boost consumption ahead of the November elections. The worse the polls get, the more might be thrown at the economy.
While politically attractive, these measures may be economically hazardous. Injecting cash into a full-employment economy fueled by tariffs is a textbook catalyst for renewed inflation and a bond market rebellion. As we are seeing right now, the risk is higher long end rates, creating a stiff headwind for valuations.
Countries such as Australia are already showing an inflationary rebound as demand returns into an economy where inflation was not “killed”. It is entirely possible that fiscal vote buying drives a similar dynamic with the market contending with expectations for rate cuts evaporating at first, followed by a 2018 like rate reversal where a later hike is required.
Sector Implications
Other things being equal, here’s how sectors and factors perform should markets follow a “typical” midterm pattern:
Phase 1: The “Pre-Election Grind” (Jan – Oct)
Characterized by uncertainty, volatility, and often a correcting market.
During the volatile lead-up to the midterms, investors typically seek safety. The “fear of the unknown” regarding tax policy and regulation can drive capital into defensive assets. Whether / how quickly we see this in 2026 may also depend on the outcomes of the Tariff and Fed questions previously discussed as well.
Top Sectors:
Energy: Historically the best performer in the pre-election phase. It is often insulated from domestic political squabbles and benefits from geopolitical hedging.
Consumer Staples & Utilities: These defensive “bond proxies” outperform as investors hide from volatility.
Healthcare: often acts as a safety valve, though it can be volatile if drug pricing is a campaign issue.
Winning Factors:
Value: Stocks with low P/E ratios and high cash flows outperform expensive growth stocks during the uncertainty.
Low Volatility: Strategies that explicitly buy “boring,” stable stocks tend to crush the broader market during the typical -17% midterm drawdown.
Phase 2: The “Post-Election Relief” (Nov – Onward)
Characterized by the “All Clear” signal, falling volatility, and a rush back into risk.
Once the results are known (and especially if gridlock is secured), the market aggressively rotates out of safety and into “risk-on” assets. This is where large returns can be made.
Top Sectors:
Technology: usually the biggest winner of the post-midterm relief rally. As uncertainty fades, investors are willing to pay higher multiples for future growth again.
Industrials: perform exceptionally well, historically averaging ~3% outperformance over the S&P 500 in the 6 months following midterms.
Consumer Discretionary: Rallies as consumer sentiment improves post-election.
Winning Factors:
Growth: High-growth companies (often Tech/Software) typically lead the recovery, snapping back violently from their pre-election lows.
High Beta: Stocks that are more volatile than the market tend to lead the charge upward.
Small Caps: Historically, Small Caps (Russell 2000) surge post-midterms because they are more sensitive to the domestic economic outlook, which usually stabilizes once the political cloud lifts.
Conclusion
The outlook for 2026 is not about a single direction despite robust earnings growth in the market. As we have been seeing since November Q3 results with the leading AI stocks, earnings growth is not enough when larger, more existential risks arise. 2026 looks set to be a year where the collision of three bodies (T-F-M) make forecasting difficult and volatility likely to return. As in physics, when there’s three large masses circling, unpredictability is usually the result.
A “Goldilocks” path exists: The Supreme Court strikes down tariffs (lowering inflation), the President appoints Kevin Warsh (soothing the bond market), and the midterms result in “gridlock” (traditionally the best scenario for markets). In this scenario, 2026 could mirror the boom of the late 1990s. Inflation is somewhat contained, the Fed can be accommodative, earnings growth continues strongly and capital remains plentiful to the businesses who need it.
However, that path requires a best case outcome across Three Large Bodies being influenced by each other and shifting based on the path of the other. Eg. If Trump loses the Supreme Court battle and feels compelled to appoint Warsh to avoid a bond market sell off, perhaps he doubles down on even larger fiscal vote buying? The point is not to predict the three outcomes - thats like picking the trifecta at the races. The point is to recognize that 3 best case outcomes is low probability and its a midterm year, which traditionally introduces even more volatility and the potential for sharp drawdowns. The discussion above of each of these factors is designed to help interpret the potential implications of the different scenario outcomes so investors can choose their desired risk and react with confidence when we see where each of these factors land.