

How to Get Ahead of Consensus Earnings & Share Price Inflections using Sentiment Analysis
with a thought provoking case study on Estee Lauder ($EL)


Important Disclaimer: The following stock discussion and analysis is subject to The Inferential Investor’s Disclaimer. It is indicative, designed to be educational and instructive on advanced techniques for AI in investment research and is not in any respect financial advice or an investment recommendation.
In investing, a profitable edge often lies not in the numbers which simply reflect what has happened, but in the narrative and management language that provide signals on the numbers of tomorrow. After all, share prices are the present value of future cashflows. So how do you analyze the same numbers everyone else has access to, but get an edge on what the future holds for a company?
Institutional allocators ask this question of fund managers virtually every meeting and managers can only answer with investment process. Individual investors never see these exchanges, but should know that it is generally considered that short term success only extrapolates via a robust process. Process is the only language that translates how a past track record might translate to similar future returns. How do you find those opportunities? How and when do you build them and exit them?
In this post, I outline and demonstrate an important aspect of investment process that has, until Generative AI, been the domain of successful quantitative managers, but is now a powerful insight driver (and edge) for both individual and professional fundamental stock pickers. If you are not using this signal, know that your competition in the market, assisted by AI, is using it and it is now available to everyone.
What is Sentiment?
Sentiment is the qualitative context, “mood” and language patterns found in earnings transcripts, presentations, management result discussions and questions and answer sessions. While consensus estimates rely heavily on quantitative extrapolation and can be lagging due to analyst inertia, a rigorous analysis of management sentiment can provide early signals of business inflection points before they show up in the P&L This is because management hold a greater information set on the company than investors. They know the plans that are in motion, the latest month’s KPIs, the orders from their customers and the most recent prices they are paying for inputs. Investors rarely do. Management sentiment is a way of measuring the aggregate of that extra information via the lens of how confident management is becoming in their statements. Increasing confidence usually signals operating improvement and vice versa. This means management sentiment is forward looking.
Artificial Intelligence, by virtue of its self-attention layers (a mathematical contextualizing method for language, conceived by researchers at Google) is capable of measuring sentiment. By encoding the confidence, defensiveness, and linguistic complexity of management and analyst language, investors, using this technique, can separate genuine turnarounds from value traps, and sustainable momentum from impending peaks (or troughs in the case of shorts).
Why does this provide an edge?
Sentiment is a signal that human analysts routinely fail to capture without the aid of AI, because it requires an evolutionary approach. That is, it requires simultaneous analysis of multiple transcripts in order to extract a relative signal. With the time it takes analysts to read and assess even a single transcript (that often runs to 2000 words), language signals are often lost to them in the detail - they simply see it as noise. I know this having run a hedge fund, analyst teams and conducted fundamental research myself for 20+ years. But language is not noise - it is simply unstructured data that contains valuable information which can be extracted with the correct tool.
With AI, we can read in multiple transcripts and instantly track the evolution of sentiment through time to identify an inflection when it appears. In the case study below I fed in 6 quarterly transcripts into a single, sophisticated prompt to measure this and isolate what had changed and when (I added a 7th transcript subsequently to extend the analysis further back). This prompt, which is engineered to call on AI’s sentiment measurement capabilities via a number of different approaches, is available to you in the Inferential Investor Professional Prompt Library.
Earnings transcripts are rich datasets where the way something is said often matters more than what is said. Sentiment analysis involves scoring language to track the direction of the business in a method distinct from the numbers (which can lag). In the Inferential Investor’s sentiment analysis (encapsulated in the earnings and transcript analysis prompts) we purposefully separate sentiment in three dimensions (management prepared remarks, analyst questions and management responses). These partitions provide additional angles to confirm (or reject) any signal by ensuring it is mirrored by analysts (often more skeptical) in addition to management (which can be promotional).
In Turnarounds: We observe that sentiment often bottoms before consensus earnings do. When management shifts from “defensive” language (e.g., challenges, headwinds, volatility) to “constructive” language (e.g., stabilization, green shoots, executing), it signals operational control is returning, even if the financial prints remain ugly. This divergence - improving sentiment amidst poor results - can be a leading buy signal.
In Momentum Situations: Conversely, when a high-flying company starts using “hedging” words (e.g., modest, somewhat, potentially) or when analysts begin asking more probing, skeptical questions, it can signal that the growth story is fraying, providing an early exit signal before a guidance cut. These situations often see a de-rating in the stock’s multiple before earnings are trimmed.
Case Study: Estée Lauder (EL) – Signal in the Noise
The recent trajectory of The Estée Lauder Companies (EL) offers a textbook example of how sentiment analysis can identify a profitable entry point in a turnaround situation. As I was testing and optimizing these prompts for my upcoming book, I identified this signal in May 2025. However, not having a background in EL 0.00%↑ I DID NOT invest (honesty on substack!?!) - only to see it rally nearly 100%. Suffice to say, I now pay a LOT more attention to my sentiment signals within my research and prompts. The power of AI is its ability to integrate context with quantitative signals. Prior to LLMs, this ability was limited to the most sophisticated quantitative managers or human analysts with a very deep familiarity with a single stock. Now, all investors can scan across stocks to find these opportunities.
The following chart shows the share price of EL (red/green bars) correlated with next twelve months (NTM) EPS forecasts from analysts (dotted blue line). I have added in a column chart of sentiment scores based on management prepared remarks from the last 7 quarterly earnings call transcripts (refer the transcript analysis in appendix).
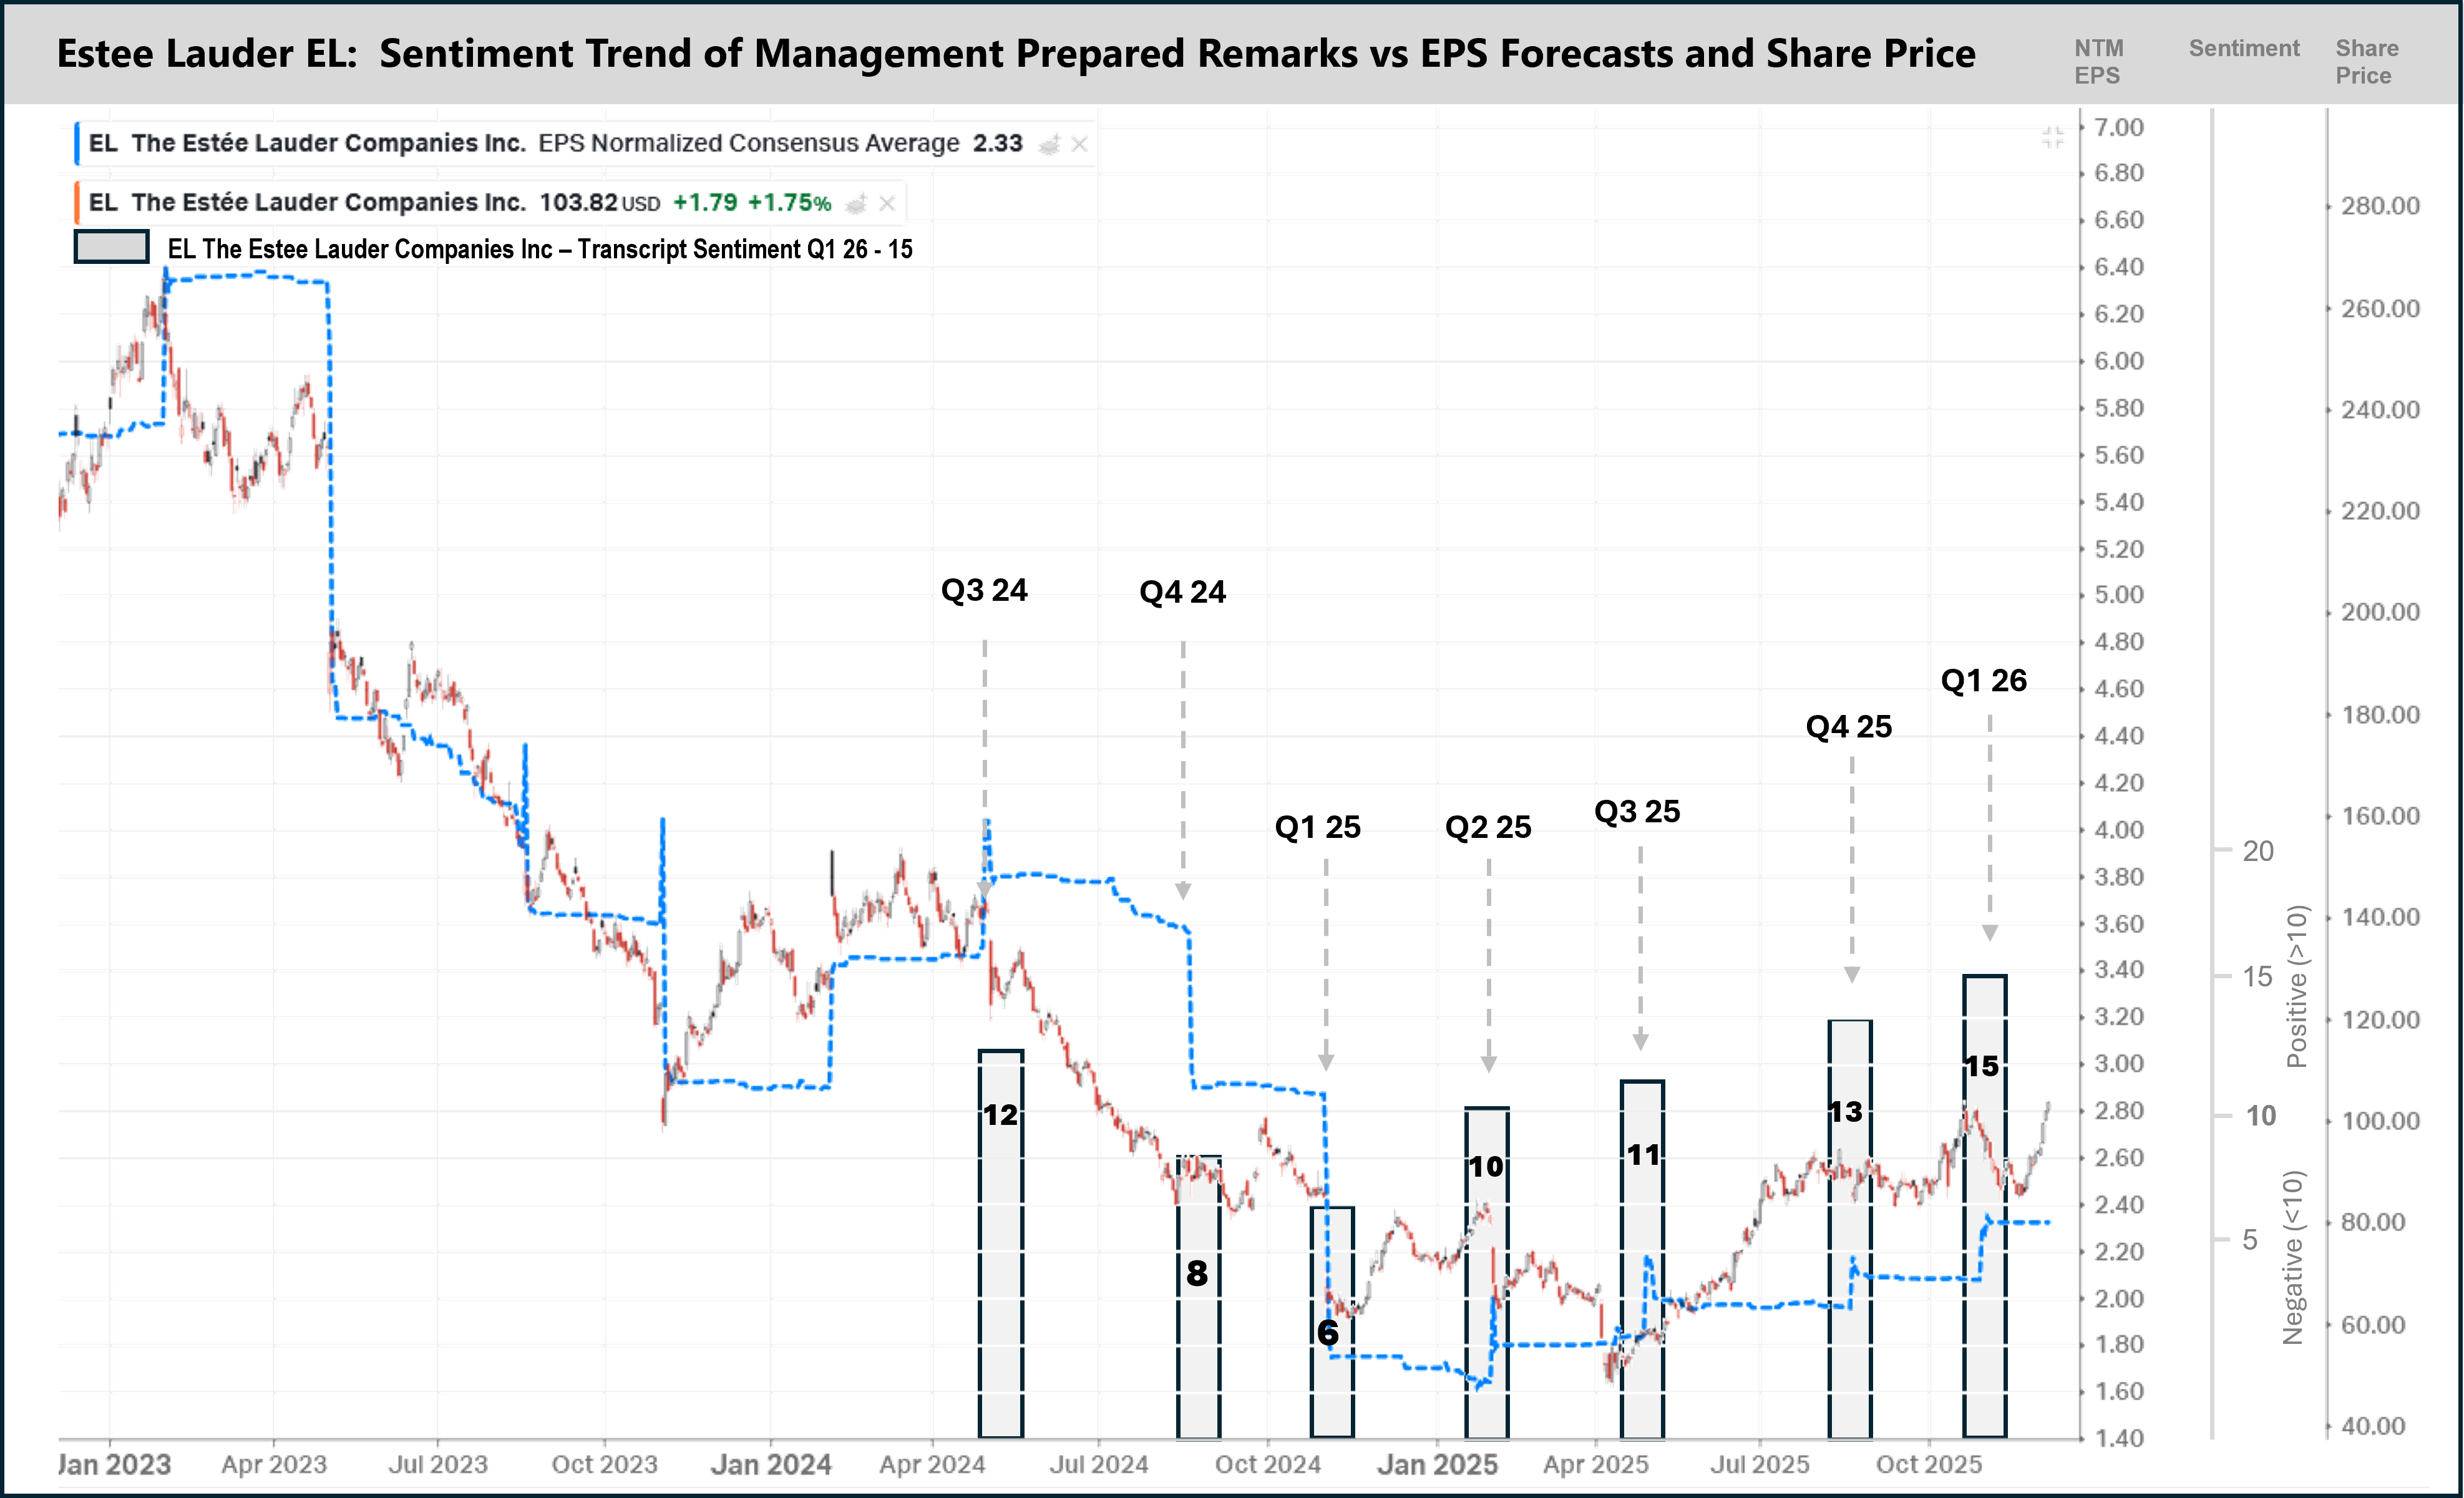
The most striking feature of this chart is the trough in sentiment (Q1 25) and rebound (Q2 25), prior to the bottom in the share price and concurrent with the trough in analysts EPS estimates. Management change and a renewed strategy were being rolled out over this period that have been instrumental in driving a share price inflection point.
The Trough: Q1 FY25
In late 2024, EL sentiment hit rock bottom. The Q1 FY25 call was a “capitulation” event: management withdrew the full-year outlook and slashed the dividend. The transcript was riddled with negative markers: “uncertainty, worsening, and pressure” dominated the dialogue. For the sentiment-focused investor, this was the “kitchen sinking”or the point where nearly all bad news is priced in, creating a potential floor.
The Rebound: Q2 FY25
By February 2025 (Q2), the narrative began to shift. With new CEO Stéphane de la Faverie at the helm, the company launched its “Beauty Reimagined” strategy. While the numbers were still in transition, the sentiment score rebounded from contraction (<10) to a “Neutral” (10/20). Management replaced passive language about “headwinds” with active verbs like accelerate, execute, and transform. This sharp improvement in sentiment tone, despite lackluster financials, was the first green shoot of a potential structural turnaround. Analysts in Q&A (see appendix), while more constructive, were still on balance negative (sentiment of 9). This was a vast improvement on a score of 5 in the prior quarter but is a score that is “less negative” rather than moving to constructive. I consider this a “cleaning” signal. With management neutral and analysts still negative, the probability that the share price will rally considerably is low in a turnaround situation.
The Confirmation: Q3 FY25
The true test came in Q3 FY25 (May 2025). The market was rattled by a sell-off associated with the “Liberation Day tariffs,” fearing that new trade barriers would derail the recovery. A superficial look at the headlines suggested a “sell.” - EL, as a consumer products company, is tariff exposed. However, the sentiment analysis of the Q3 transcript told a different story. Despite the external tariff impacts, management’s tone remained resilient and constructive. They explicitly discussed “mitigation strategies” and “task forces” rather than succumbing to the panic. They highlighted share gains in key markets like China and the U.S. for the first time in years and indicated that 2026 would see a return to growth. Analyst sentiment (refer appendix) also improved to neutral, despite the overriding tariff linked question marks. There were plenty of questions on the potential impacts but management were optimistic on being able to offset them. If you simply read the words of the transcript, an investor would focus on the uncertainty. Sentiment analysis was able to dig deeper and highlight an underlying improvement.
This divergence, shown in rising management sentiment in the face of negative macro headlines, confirmed that the underlying business drivers were stronger than the market realized. For investors who trusted the sentiment trend over the tariff fears, this created a highly attractive potential entry point around $50-$55 a share. This proved to be the trough in the share price, even despite a YoY sales growth trend in the subsequent quarter (Q4 25) deteriorating further to -13%. A pure focus on the numbers would have missed this entirely. Sentiment analysis bottomed first and coincided with highly negative analyst forecasts being upgraded (seen in the blue line), catalyzing the start of the share price rally.
The subsequent validation in Q1 FY26, where the company returned to organic growth, further fueled a rally that has seen the stock rise ~100% from those lows, proving that listening to the signal of sentiment is often more profitable than reacting to the noise of the numbers alone.
How can an investor track sentiment signals and what other situations are worth watching?
The easiest way to track sentiment with some measure of consistency is to use a custom prompt that is repeated each time so there is continuity in the signal. Our prompt library is set up for exactly that. These are not 5 line instructions to the AI model. The Transcript analysis prompt runs to 1,500 words itself and, as in the EL example, has been tested with up to 7 transcripts at a time so it is robust.
We also look to extract as much signal from natural language as possible to provide additional context to any sentiment shift. Sentiment scoring is one lens, however I overlay term frequency tracking, tern frequency-inverse document frequency (identifying the most important terms with a document, across a set of documents), analysis of themes, separation of management versus analyst language etc.
Right now I have a watching brief of a number of potential turnarounds:
Nike - improved sentiment and EPS upgrades recently started
PayPal (invested on recent expectations reset) - a most recent deterioration in sentiment regarding 2026 signaling the turnaround will be longer dated
Wayfair (invested) - a major improvement in sentiment over the last 2 quarters now reflected in the share price.
Adobe - improving sentiment as AI product traction is being shown with analysts still negative but starting to get more constructive.
An interesting extension on this analysis that I have demonstrated recently (with PayPal) is to follow the transcript analysis within the same chat with a consideration of consensus forecasts. You can upload a screenshot of quarterly consensus data and using the information the model has extracted from the transcript exercise, prompt it to consider each forecast line item (or assumption) and its appropriateness given the information extracted. See here for an example of this…
If you have questions on this or other techniques, I am always open to help. Reach me in the comments or DMs.
regards
Andy West
The Inferential Investor

Appendix: The Estee Lauder Turnaround Trajectory
Summary:
From Trough to Recovery: The period spans a significant operational trough in FY25, characterized by guidance withdrawals, dividend cuts, and impairments, followed by a pivot to growth in Q1 FY26. The narrative shifts from “managing decline” (inventory destocking in China/Travel Retail) to “igniting growth” under the Beauty Reimagined strategy.
Leadership & Strategy Reset: A major regime change occurred in mid-FY25 (Feb 2025) with Stephane de la Faverie (CEO) and Akhil Shrivastava (CFO) taking the helm. They introduced “Beauty Reimagined,” expanding the Profit Recovery and Growth Plan (PRGP) to include deeper restructuring (5,800–7,000 positions) and a focus on speed/agility1111.
Guidance Volatility: Visibility was severely limited in early FY25, leading to a full withdrawal of the annual outlook in Q1 FY252. Guidance was reinstated in Q3 FY25 and stabilized by Q4 FY25/Q1 FY26, with the company returning to a regular annual outlook cadence but removing quarterly guidance to maintain flexibility3.
China & Travel Retail Stabilization: The “Asia Travel Retail” (TR) overhang dominated FY24 and FY25. By Q1 FY26, TR inventory was deemed “rightsized” 4, and China returned to growth, acting as a tailwind rather than a headwind for the first time in several quarters5.
Profitability & Tariffs: While gross margins consistently expanded due to PRGP efficiencies (e.g., +310 bps in Q1 FY25), new headwinds emerged in late FY25 regarding tariffs, estimated at a ~$100M impact for FY266. Mitigation strategies (regional manufacturing) are a key focus.
Channel Pivot: A decisive shift occurred from protecting legacy channels to aggressive expansion into “winning channels” like Amazon Premium Beauty (US/Canada/Mexico/UK) and TikTok Shop, acknowledging previous slowness in adapting to consumer shifts7.
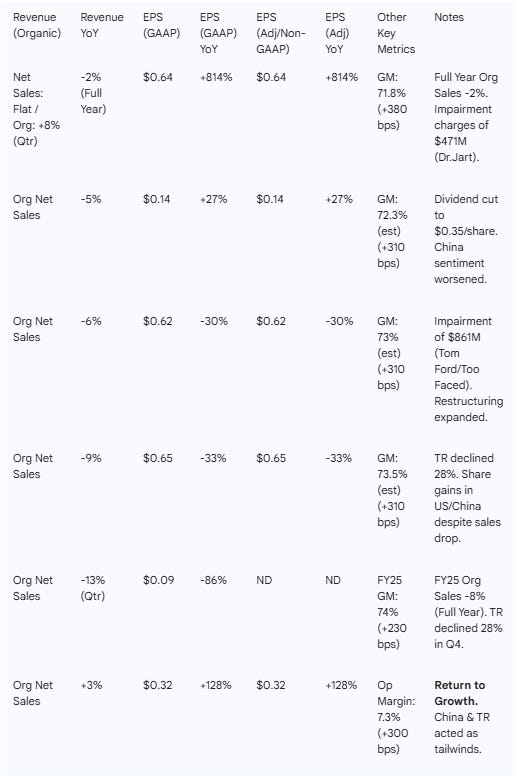
1. Results & YoY Growth
Note: FY25 was a transition year marked by declines, while Q1 FY26 marks the inflection point to revenue growth with sentiment and the share price bottoming well before this.
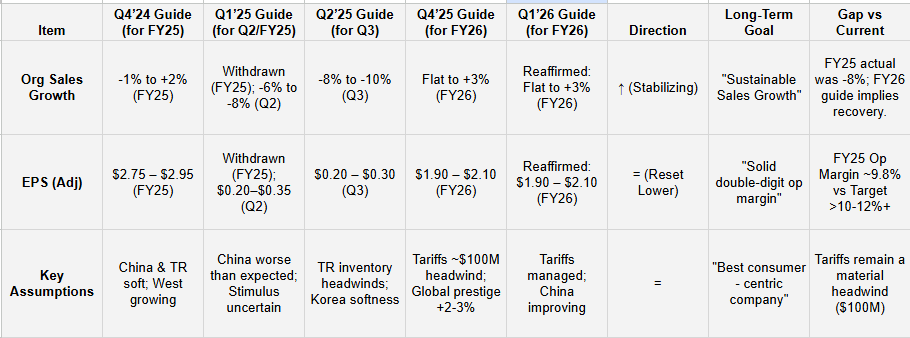
2. Guidance & Goals Evolution
Evolution: Guidance visibility collapsed in early FY25, leading to a withdrawal. Upon reinstatement, expectations were reset lower. By FY26, the company returned to issuing annual guidance with a focus on modest growth and margin rebuilding.
Management Quotes on Forward-Looking Statements:
Q1 FY26 (Oct ‘25): “We expect tariff-related headwinds to impact profitability by approximately $100 million... We continue to evaluate additional strategies... including more PRGP initiatives and potential pricing actions.” 17
Q4 FY25 (Aug ‘25): “Beginning with fiscal ‘26, we are providing only an annual outlook. This approach gives us more agility... to navigate ongoing volatility.” 18
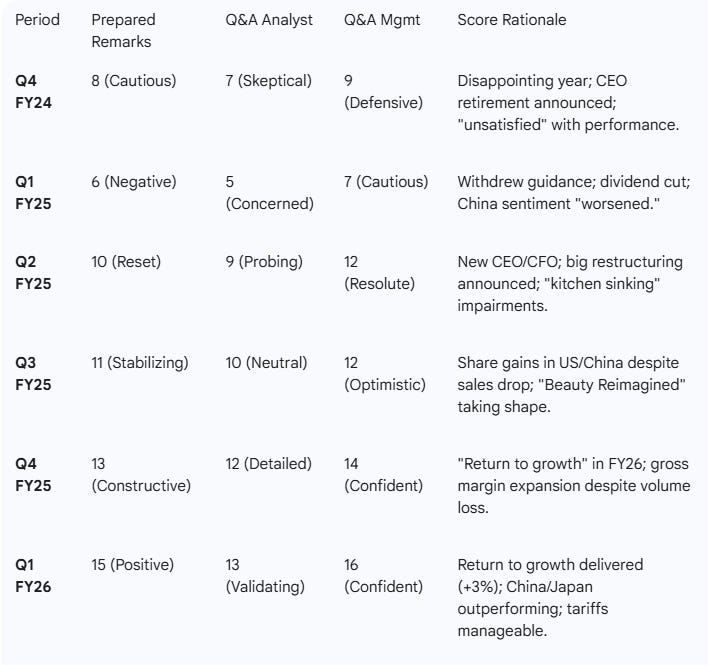
3. Sentiment Analysis (0–20 Scale)
Trend: Sentiment bottomed in Q2 FY25 (Feb ‘25) during the “kitchen sinking” of bad news by new leadership. It has since recovered to “Constructive” levels in Q1 FY26 as growth returned.
4. Thematic Summary (Prepared Remarks)
Q1 FY26 (Oct 30, 2025) - The Return to Growth
Growth Drivers: Organic sales +3% driven by Mainland China returning to growth and double-digit growth in fragrance25.
Strategy: “Beauty Reimagined” driving results; new partnership with Shopify to modernize DTC and expansion on Amazon Mexico/UK26.
Margins: Operating margin +300 bps to 7.3% due to PRGP benefits reducing non-consumer costs by 3%27.
Risks: Tariffs remain a headwind of ~$100M, partially offset by supply chain mitigation28.
Product Trends: Fragrance up 13% (best performing category); Skin care up low single digits29.
Q4 FY25 (Aug 20, 2025) - The Pivot Point
Challenges: Q4 sales -13% largely due to Travel Retail declining 28%; FY25 EPS down 42%30.
Strategy: “Beauty Reimagined” operationalized; online mix reached record 31%31.
Capital Structure: Free cash flow priority; CapEx reduced to ~4% of sales32.
Margins: FY25 Gross Margin expanded 230 bps to 74% despite sales deleverage, proving PRGP efficacy33.
Risks: Tariffs introduced as a major topic; potential $100M impact34.
Q2 FY25 (Feb 4, 2025) - The Strategic Reset (New CEO/CFO)
Strategy: Launch of “Beauty Reimagined” with 5 pillars; expanded PRGP to cut 5,800–7,000 positions35.
Challenges: Sales -6% driven by double-digit declines in China and Travel Retail36.
Impairments: Recorded $861M impairment for Tom Ford and Too Faced37.
Growth Drivers: Clinique on Amazon US success; gains in Japan38.
Leadership: New executive team established; flatter structure39.
5. Analyst Q&A Themes & Evolution
Q1 FY26 (Oct 2025)
Theme: Sustainability of China Recovery.
Question: Is the China growth sustainable or just comps? 40
Answer: China grew double digits in retail sales (outperforming market); “peak of consumer confidence... starting to rebound.” 41
Theme: Tariffs & Margins.
Question: How do tariffs impact the gross margin guide? 42
Answer: GM flat/positive despite tariffs; mitigation via regional manufacturing (Japan plant) and potential pricing actions. 43
Theme: Volume vs. Price.
Question: Are you seeing unit growth? 44
Answer: Yes, returned to unit growth this quarter; driven by entry-prestige pricing (The Ordinary) and smaller sizes in fragrance. 45
Q4 FY25 (Aug 2025)
Theme: Visibility & Guidance.
Question: What is the level of visibility in the FY26 guide? 46
Answer: China and Travel Retail inventory are “rightsized,” giving better visibility than prior years. 47
Theme: North America Turnaround.
Question: How long until NA grows consistently? 48
Answer: Amazon acting as a “megaphone”; channel mix shifting away from department stores (now <1/3 of business). 49
Theme: Travel Retail (TR).
Question: When will TR turn positive? 50
Answer: TR inventory clean; expected to return to growth in FY26, but H2 weighted. 51
Q2 FY25 (Feb 2025)
Theme: Portfolio & Divestitures.
Question: Are you considering selling brands? 52
Answer: Regular portfolio review is conducted; focused on “transformative innovation” and fixing existing brands first. 53
Theme: Dividend & Cash.
Question: Why cut the dividend now? (Asked in Q1, reiterated in Q2 context).
Answer: To create financial flexibility for the new leadership to invest in growth. 54
6. Term Frequency & Evolution
Top 5 Positive Terms (Most Recent Transcript - Q1 FY26):
Growth: (Used heavily to describe the pivot, e.g., “Return to growth,” “Sustainable growth”).
Momentum: (Describing China and Fragrance).
Expansion: (Referring to Amazon, channels, margins).
Benefits: (Referring to PRGP savings).
Confident: (Management’s tone regarding outlook).
Top 5 Negative/Cautionary Terms (Most Recent Transcript - Q1 FY26):
Tariffs: (New major risk factor).
Volatility: (Macro environment description).
Pressure: (Travel Retail in the East).
Decline: (Referring to specific sub-segments or prior year comps).
Uncertainty: (Geopolitical landscape).
Evolution of Key Themes (Frequency Analysis):
“Inventory”: High frequency in FY24/early FY25 (associated with “Destocking”). Frequency decreased in Q1 FY26 as inventory was deemed “rightsized.”
“China”: Consistently high, but context shifted from “Headwind/Decline” (FY24/25) to “Growth/Outperformance” (Q1 FY26).
“PRGP” (Profit Recovery Growth Plan): High frequency starting Q4 FY24, peaking in Q2 FY25 (expansion of plan), remaining a key driver of margin narrative in FY26.
“Amazon”: Low frequency in FY24; surged in FY25/26 as a key pillar of “Consumer Coverage.”
“Tariffs”: Absent in FY24/Early FY25; emerged as a top risk keyword in Q3 FY25 and Q4 FY25.
7. TF/IDF Analysis (Simulated)
Q4 FY24: Key Terms: “Destocking,” “Hainan,” “Profit Recovery.” (Focus on fixing the TR inventory glut).
Q1 FY25: Key Terms: “Withdrawn,” “Dividend,” “Sentiment.” (Focus on the crisis of visibility and capital allocation).
Q2 FY25: Key Terms: “Reimagined,” “Restructuring,” “Impairment,” “Agility.” (Focus on the strategic reset and cleaning the balance sheet).
Q1 FY26: Key Terms: “Tariffs,” “Sequential,” “Unit Growth,” “Shopify.” (Focus on operational hurdles and evidence of turnaround).
Summary: The terminology evolves from defensive (fixing inventory, cutting dividends) to structural (restructuring, reimagining) to offensive (unit growth, expansion, dealing with external tariffs).
8. Red Flags & Open Questions
Tariff Exposure: Management estimates a $100M impact55. While mitigation is underway (moving production to Japan/US), if trade policies worsen beyond current assumptions, the FY26 guide is at risk.
Tax Rate: The effective tax rate is very high (40.5% in Q1 FY26, ~36% FY26 est) due to geographical mix and stock-based comp issues56565656. This is a significant drag on EPS leverage.
Impairments: Significant impairments taken in FY25 ($861M in Q2, $425M in Q4) for Tom Ford, Too Faced, and Dr.Jart+57. Are values finally reset, or is more goodwill at risk?
Travel Retail (East) vs. West: While TR West is growing, TR East (Asia) remains challenged by “persistent retail softness”58. If Chinese traveler conversion doesn’t improve, the “return to growth” in TR relies heavily on comps.
Margin Quality: Much of the operating margin expansion is coming from cutting non-consumer expenses (PRGP). Can they sustain innovation/marketing spend (consumer-facing) while cutting the muscle of the organization (20% middle management cut)59?