

How to Create a Daily Technical Market Timing System in Claude Cowork
Here's the Full Stack Set Up


My investment process can be simply summarized as follows:
Use top down analysis to identify changing operating conditions that will lead to observable acceleration or deceleration in the operations of affected businesses over a medium term.
Use fundamental analysis to identify and measure valuation upside and downside over a 6-18 month horizon in those stocks focusing on directional forecasts in both multiple and valuation metric.
Use technical timing signals across asset classes, indices and factors to manage gross and net exposure in the portfolio for shorter term shifts.
This article focuses on the last of those steps - exposure management built around probability based assessment of market timing indicators. We all know that timing the market is incredibly difficult. However, there are certain set-ups that are commonly associated with more predictable movements in equities and the following tool design provides a systematic approach to identifying those. I specifically use this, alongside a contextual alignment of the reasons why these signals may be appearing, to manage my exposure to individual names in the portfolio and even my overall equities exposure at the gross and net levels.
The usual important disclaimers to this apply: past performance is not an indicator of future performance. AI can make mistakes and needs to be checked. Please refer to The Inferential Investor’s Disclaimer. This report is not intended as investment advice or a recommendation to buy or sell any security. It is an educational resource for those wishing to expand their use of AI in investment research.
What you need
Claude Cowork: This is your agentic engine to structure the data architecture, memory, processes and scheduling to make this task systematic. A $20/mth Pro plan is sufficient for this routine.
Data: For this routine, all you need is daily closing prices and volume. I have connected Claude Cowork to Alpha Vantage for the data via their MCP. A free tier subscription limits you to 25 API calls a day (which isn’t much), but if you focus your security list to market indices, factors and a few bellwethers, then this is sufficient. Of course, as with most data, it can get expensive quickly if you want to ramp this analysis up. (Note: to expand this analysis to 300 stocks concurrently, you’d need to upgrade your AV data API to a USD$1,500 a year option plus expand Cowork to a Max subscription at $1,200-$2,400 a year on top otherwise you will hit Claude session limits fast. You could batch stocks into 4 separate pre-specified API requests and potentially lower you data cost to USD$500/yr if you want.)
Time: An hour or two of set up and calibration is all thats required.
Initial Set-Up
Pre-work: I’m assuming here that users have the Claude desktop app and have installed Cowork and a data MCP connection. If not, then download the app and google instructions for setting it up. You will also need to go to Alpha Vantage and obtain a free API key for your MCP set up. MCPs are added simply in the Claude desktop app via Setting > Connectors > Add Custom Connector. Follow the instructions at this address (look for “Install in Claude”): MCP set up instructions .
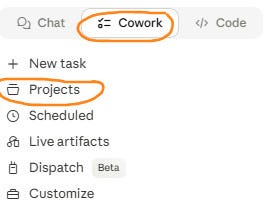
Project Set-up: Start by setting up a new project in Cowork (Projects > New Project > Start from Scratch). This will house all the artifacts and analysis required to run this workflow on a daily basis, including building a memory of the indicators through time.
Name your project (eg Daily Technical Analysis Probability Assessment)
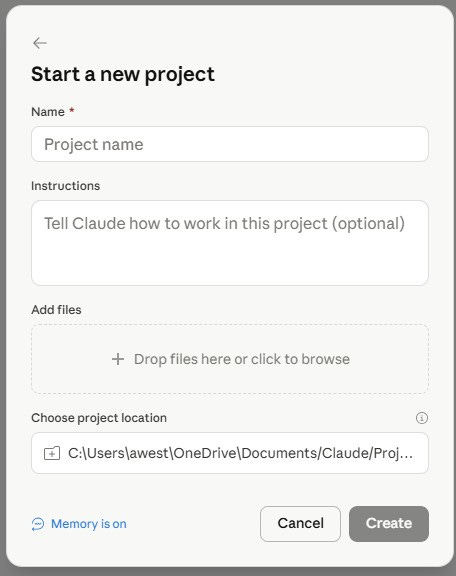
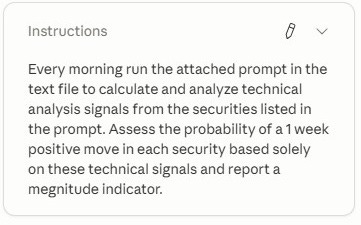
Add general instructions to the model as you can see in the example below (excuse the spelling mistake that I just noticed - not that it matters):
Drag and drop the core prompt file (ready made one below) where indicated. Its much easier to author your prompt in notepad and import it, than to type it into the Claude chat interface later. This will reside in the project and be used by Cowork to guide the workflow each day. At its core, this is really only used once by the project to set up the code that runs the analysis. You can interact with the project after set-up to change parameters and fine tune, so don’t get too hung up on this prompt and making it perfect. Here’s my simple prompt that you can edit and/or import (download below in PDF). This is set up to look at the major market indices, sector ETFs (for sectoral signals) and factor ETFs (for factor timing). You can change those securities to single stocks or whatever you want. As for indicators, I use this mainly for shorter term timing signals, and so focus this list on indicators that assist over that horizon. I use 20 day MA’s (simple and EMA plus crossovers, RSI, MACD (including divergences for both), On Balance Volume and Support and Resistance levels. Claude knows how to calculate these indicators and I have checked their outputs against other sources like TradingView. Its actually quite impressive how native technical analysis is to these models. The weighting and rules around use of these for scoring etc, follow later and are not in this prompt. This just sets up the basic structure.
Choose a Project Location: Set up a projects folder and select it where indicated. Important note - I have found that if you have Microsoft’s one drive set up to sync automatically (as most do in windows), then it can be best to set up your projects folder outside One Drive (eg C:\projects\). While this means it will not be backed up to the cloud automatically, I have found that running code in Claude can be impacted by One Drive syncing activity within the sub files of a project or code base. It can cause real headaches, so I do it all outside the One Drive sync’d folders.
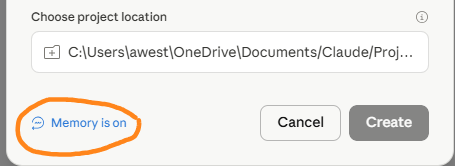
Ensure Memory is on.
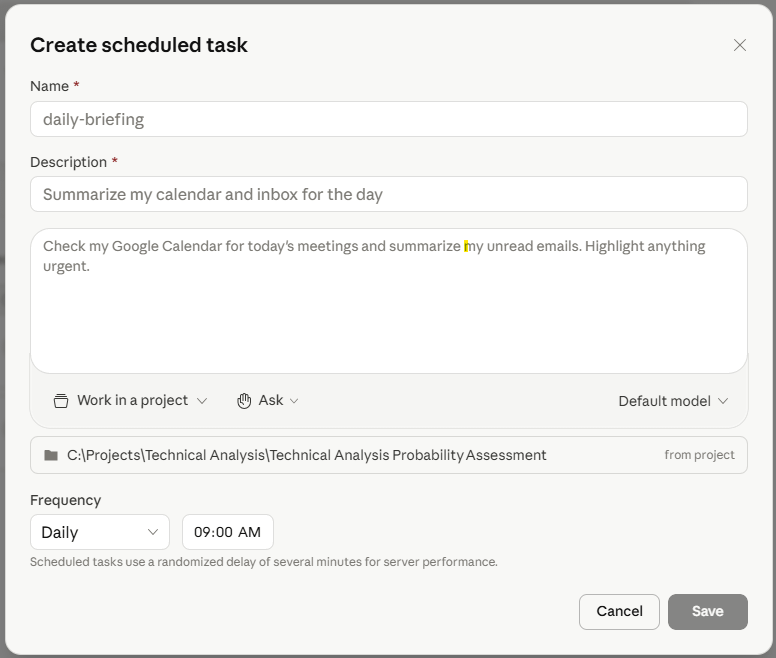
Schedule Your Task: Click “+” in the Schule Box on the right hand side of the project screen. Its a little redundant but I copy and past the “instructions” set up before into the scheduling description box. The most important bit is the “Frequency” set up at the bottom of the dislogue box shown before. Set this to daily and a time (this is your local time and you must ensure your PC is on, not asleep and Claude app is running).

A fully agentic investment analyst experience coming Q4 2026. Covering tens of thousands of stocks globally, and backed by live fundamental data and investor relations materials, access instant earnings analysis, stock deep dive reports, institutional level fundamental analysis, idea monitoring, inter-stock connection reports and multi-step investment process replications. Create your own workflows and schedule them agentically.
Run the Initial Analysis
When I set up a new project, I like to test the data connection manually at the outset, by loading in data that will be useful for the project. In this case I suggest loading in 100 days of price and volume data for the listed securities by running the following prompt in the Project’s chat box:
Retrieve daily closing prices and volume data via the Alpha Vantage MCP for the last 100 trading days, for the securities listed in the prompt text file attached to the project, and store in a CSV file with the following structure: securities as rows, dates across the columns. Show this file once created.
Let that run and then check the output file against a 2nd source. Ensure Claude has completed the task for your specified securities and has the right data via the MCP. This data should also appear to have been saved into the project folder and reflected in project memory. Verifying this provides confidence in the project set-up. It worked first time for me.
Once that is verified, run the initial analysis to calculate the technical analysis indicators and probability assessments. You can do this by prompting the following, if the analysis hasn’t already been run by the system:
Using the downloaded price and volume data, run the prompt in the project’s text file to produce the initial analysis and present the summary.
An important note on the probability assessments:
My provided prompt uses a blended multi-signal approach to probability assessment of a bull or bear move in the security over an indicative 1 week window. Multi-signal approaches have been shown in academic research to provide the most useful predictive value but as is probably obvious, this is an indicative signal, not a perfect predictor of the future.
Academic research shows this approach improves predictive timing above random selection (eg random being that on average ~56% of 1 week forward moves are positive over time. Google the research.). However, Claude is trained on indicator calculation and how to score a system but does not backtest the system and cannot make the probability assessments relative to the security’s own trading history. Any probability assessment is calibrated only against the broad research it has ingested in training and so is “theoretical”. I have used these indicators via charting systems for years and so am comfortable with their predictive error rate. If you are new to a multi-signal system, I suggest you set this up and watch it over at least a few months first so you can see where it works and where it doesn’t.
I prefer to use the probability assessments by seeing how they change and trend day to day, rather than putting too much stock in the actual percentage itself. The predictive window itself is also rubbery. In essence it is the indicators themselves that dictate the predictive window (eg a 14-day RSI and standard MACD are shorter term indicators, whereas if you include 90 and 200 day MA’s, this horizon elongates, as does the risk).
Optimizing and Fine-Tuning the System
By this stage you have set up the project and run the initial analysis. From here you can use the chat interface to adjust the project code which allows you to do things like:
Fine-tune the probability assessment scoring system and indicator weightings
Add and remove securities and indicators
Add in additional signals drawn from the indicators such as divergences.
Adding in Technical Divergences:
When you set this project up, the prompt I provided specified divergences but didn’t provide detail on how to utilize these. I found that Claude ignored this and it needs to be set up with a specific prompt. Claude is trained to measure divergences so once again it is not necessary to specify calculation (which would be highly technical(. Instead you just need to instruct it to be added and specify parameters as per below. If in doubt, first ask Claude within the chat interface of the project how it is using, weighting and scoring all the indicators to get further detail. However, by default for me with the RSI and MACD indicators, the model set it up to examine the level of the indicator and the inter-day change (direction). Research suggests that divergence is one of the most predictive measures for these technical indicators and is worth adding in as follows:
Add divergence detection to the project code for RSI and MACD indicators using 30 session swing point analysis. A confirmed divergence should send a 1.0 unit signal within its category and be the heaviest single signal in the model.
This instruction was sufficient to set up a sophisticated divergence detection and scoring signal and add it into the multi-signal model.
Setting up a Flag vs Scoring for Support & Resistance
Right now, Support and Resistance levels are calculated by Claude and used within the scoring system however I find this less than ideal. A price above support and rising, but close to resistance may well be a bearish indicator short term. It can also potentially lead to a break-out. Consequently, I find these signals to reduce the predictive power of a multi-signal system and prefer to use them as “flags”. By that I mean I remove them from the scoring model entirely but still have them calculated and monitored. The system then flags the S and R levels in the output and notes in the text summary when prices are approaching one or the other. This can then be viewed in the context of the other signals. Its essentially a “note to self” to be aware of the level but view it in context, without diluting the information content of the techical multi-indicator system. Do this as follows:
Remove support and resistance from the overall scoring but retain calculation of the S/R levels and make price being within 3% of a support or resistance level a flagged note in the summary report and individual security signal breakdowns.
Re-weighting the Indicators
The initial system set up by Claude under my prompt is a fairly blunt equal-weight scoring system. However, I prefer to overweight RSI and MACD signals to try and capture turning points. You can adjust these as you see fit and fine tune multiple times. Each time, Claude will re-run the analysis and you can see the output and how it changes the signals. My final re-weighting used the following prompt:
Re-weight scoring as follows in the code: RSI 30%, MACD 30%, OBV 15%, EMA/MA crossover 15%, MA20 10%. Re-run the report.
Note that there are essentially 3 RSI sub-signals (level, change and divergence) and 3 for MACD. Under this approach, each has a 10% weighting. You can re-weight those as well, if you choose, by using the same prompt structure and the names it uses in the report for the individual sub-signals.
Conclusion & Output
Now you have a fully agentic technical analysis multi-signal system running for you daily on your specified stocks. It produces a concise summary each day flagging the most bullish and bearish set-ups in your list, a full technical signal data report with probability assessment scores, S/R proximity alert flags and highlighting what has changed materially from the last day.
The output file each day provides the price and volume data, indicator levels and percentage bull and bear probability assessments. Below this it provides detailed data on each signal for each security. I partner this with tradingview where I have a custom chart set up to visually see the same indicators for the stocks that are flagged by Claude. If you care to incur the data charges to expand your allowed API calls to hundreds of securities, then this can become a very powerful short term timing tool. The value it adds is in running agentically and flagging to you where to focus in. This is a major leap forward from dashboards that overwhelm with pages of numbers and no insight.
That philosophy is at the core of Inferent Analyst - the new agentic investment research system being developed for launch later this year. This will produce stock deep dive reports, institutional level fundamental analysis, idea monitoring, inter-stock connection reports and multi-step investment process replication amongst other features. Pre-register now for a bonus on launch here:
Let me know if you have any problems setting up this system,
Andy West
The Inferential Investor

👍