

How AI Identified the Oracle Opportunity
and the fundamental investment process that anchors it

Important Disclaimer: This post is indicative, for education purposes only and not intended to be financial advice. Readers are referred to the full disclaimer accessible from The Inferential Investor blog site. No recommendation either express or implied to buy or sell any security is made by the author. Any forward looking statements are subject to uncertainties and change without notice to readers of this post. Investments in financial securities are subject to numerous risks including the loss of part or all of your capital and advice should be sought from a registered financial advisor before any investment decision is made.
Yesterday, Oracle ($ORCL) lit up the markets surging 35% in a single session and climbing nearly 170% over the past sixteen months. The result? Larry Ellison became the richest person on the planet.
This wasn’t some random rocket ship. The opportunity was eminently identifiable using a straightforward investment framework I call C.I.V.C., paired with the right AI research tools. In fact, I broke down this exact setup months ago in a case study for my upcoming book.
Now that Oracle is making headlines again, it’s the perfect time to share the highlights of that analysis here.
Oracle Corporation Stock Price: May 2024 - Sept 2025

A Repeatable Process for investor and machine collaboration:
This approach isn’t a one-off trick. It’s repeatable, scalable, and faster than ever thanks to today’s AI research tools. I’ve used it successfully across two decades (before AI), and it continues to uncover high-conviction opportunities like Oracle.
The Framework: C.I.V.C.
At the core of the process is a simple framework: C.I.V.C. — Change, Implications, Valuation, Catalyst.
While I won’t unpack every step here (they span several chapters of my upcoming book), I’ll zoom in on two key components that are critical to:
Spotting the opportunity early - and how AI fits in; and
Sizing the potential upside at the time of entry
Finding the “Oracle’s” Before They Rally
In equity markets, you’re not just buying businesses, you’re buying against expectations. If a company grows exactly as the market predicts, on average your long-term return will approach the stock’s cost of equity. That’s rarely compelling. This can be shown by both finance theory and in real-world data:
Selection of Stocks comparing 10-year returns with earnings growth and cost of equity:

Note in the table above how no matter if the stock was fast growth like Salesforce, T-Mobile or Adobe or mature like P&G, Cisco or Wells Fargo, the long term returns sit closer to the cost of equity than the stock’s earnings CAGR.
I studied this dynamic during my PhD nearly thirty years ago, and it’s held up across theory and experience:
Outsized returns are driven not by growth alone, but by growth that exceeds expectations.
Yet most investors fall into the trap of assuming that stock returns should match earnings growth each year. That’s a misconception. Only when growth surprises to the upside (or downside) do returns diverge meaningfully from the cost of equity anchor.
Which brings us to Oracle. Its 170% rally didn’t come from nowhere. It came from an inflection point in growth that the market underestimated. That kind of mispricing, where expectations are too conservative, is exactly what C.I.V.C. is designed to surface.
Expectations are almost always wrong when conditions accelerate or decelerate (“change”). Make this the core of your process.
How Oracle fit this framework and was identified:
Enter Oracle. Once a poster child of the internet boom, Oracle had long fallen out of favour with growth investors. Over the past decade, it delivered only ~4% annual revenue growth and ~6% earnings growth - a far cry from the explosive trajectories seen in other tech giants.
Why the stagnation?
Oracle maintained dominance in on-premise database and enterprise software solutions for large corporate and government clients. But as the industry shifted toward cloud-native architectures, a wave of agile competitors emerged offering flexible, scalable alternatives that eroded Oracle’s legacy grip.
At its peak in 2006, Oracle’s database market share exceeded 40%. By 2024, that figure had reportedly fallen to just 10%. The company remained profitable, but was broadly viewed as a mature, low-growth cashflow machine.
The market priced it accordingly.
Oracle’s earnings and revenue profile was low volatility, low surprise, and consensus expectations reflected that flatline. The stock consistently underperformed cloud and software peers, and by September 2024, its valuation was deeply discounted:
P/E of 22x compared to
Nasdaq 100 average of 27x,
with Oracle having traded at an average ~35% discount to the Nasdaq 100 for the past decade.
In short, the setup was classic: low expectations, stable core business, and little priced in for change. Which is exactly where the C.I.V.C. framework thrives.
What changed?
In a word: AI. Artificial intelligence had been brewing quietly in the background for years, mostly the domain of tech giants and deep-pocketed enterprises. But in November 2022, everything shifted. The release of ChatGPT, powered by OpenAI’s GPT-3, kicked off an AI arms race and crucially, it expanded the market. AI was no longer just for large IT departments. It became accessible to consumers, SMEs, and startups practically overnight.
Everyone knows that story now. But what very few investors realised then and what made Oracle so compelling was this:
Oracle had already been quietly re-engineering its core database infrastructure for the cloud. And in the new AI economy, that mattered.
Here’s why:
Generative AI models (and their discriminative and specialized cousins) are incredibly dependent on fast, scalable, and reliable cloud-hosted databases - both for training and inference.
Oracle’s database technology, long a legacy asset but also their core speciality, had been rebuilt to outperform major cloud providers on cost and speed for AI model training.
In a space where every marginal cost saving compounds at scale, Oracle’s edge in performance and price efficiency mattered a lot.
As corporates rushed to migrate data from on-premise to the cloud to enable AI workflows, Oracle was suddenly not just relevant, but essential.
They had quietly become the fourth global Hyperscaler. And almost no one noticed.
So the real question becomes: how was this inflection point identifiable before the 170% rally?
Mapping the Change
Throughout 2024, Oracle’s earnings calls began to tell a different story. Management was no longer just reporting incremental growth, they were signposting a transformation.
The spotlight shifted to Oracle Cloud Infrastructure (OCI), the division responsible for building, managing, and scaling Oracle’s internal data centers and cloud services for clients. As Generative AI demand exploded, OCI’s contracted pipeline surged.
In call after call, Oracle’s leadership began projecting what they called a “financial acceleration.” First came the narrative about acceleration. Then later, the numbers.
Oracle began guiding toward 20%+ revenue growth from FY27 to FY29,
with operating leverage expected to kick in by the back half.
For a company that had barely managed low single-digit growth for over a decade, this was a stark and investable inflection. The signs were there for anyone looking, even if you weren’t following Oracle closely. With today’s AI tools, identifying such shifts is easier and faster than ever.
Simple AI assisted techniques to identify such opportunties:
You don’t need a 10-person research team. Just the right process and tools.
Here are two ways I used AI to surface Oracle’s inflection - methods anyone can replicate:
1. Transcript Intelligence with Tools like Quartr
AI-assisted transcript search tools are indispensable. Using platforms like Quartr, I regularly search across companies for keywords like:
“revenue (or earnings) acceleration” / “deceleration”
“long-term margin target”
“rate of growth”
“growth inflection”
These searches flagged Oracle’s inflection point from management’s comments clearly. From there, I used a large language model to interrogate transcripts, financial reports, investor commentary, and news, gathering context around why management was expecting that acceleration, and whether it was credible.
2. Stock Screens Enhanced by LLMs
I run a rolling quantitative screen that updates quarterly, tracking:
Revenue growth
Earnings momentum
Operating margin changes
The screen compares the most recent quarter to 1-year and 2-year trailing quarterly trends. I then prompt ChatGPT to:
Flag companies showing significant trend reversals
Pull insights from earnings calls, press releases, and analyst notes
Tie those insights back to the observed inflection
Integrate valuation metrics in a chain-of-thought analysis
In Oracle’s case, both methods converged. First management commentary from transcripts and in later quarters the financial inflection and execution from Q4FY25 - pointing to a major shift in growth narrative that the market had yet to fully price in.
How do you value such an opportunity when the Change is identified?
There’s as much art as science involved in valuing a business at an inflection point and I deal with this at length in the upcomming book, but the core principle is elegantly simple:
When the market’s expectations materially shift, so does the stock’s valuation multiple.
In other words, a company undergoing a structural improvement in growth prospects will almost always see its P/E ratio (or Price/Sales, EV/EBITDA, etc.) re-rate upward. That’s because valuation multiples are functions of expected future cash flow growth.
If those cash flows are now projected to be materially higher, the market will pay more today for the same dollar of earnings.
The key for the investor is early identification. That’s where AI-assisted analysis excels in scanning signals before they’re fully priced in. AI is also used to compute standard deviation thresholds with which to anchor valuation targets. Look at any history of P/E ratios. They dont sit at the long term average, they move through it. Acceleration drives them up 1 or 2 stdev’s and deceleration, the opposite. This is why I loathe using average multiples to value stocks. Its not real world relevant.
When you capture both:
Earnings upgrades from accelerated growth, and
Multiple expansion from re-rating,
you don’t just benefit from one tailwind, you get compound upside. That’s the engine behind the outsized returns seen in cases like Oracle.
Oracle’s P/E ratio relative to the Nasdaq 100: 2015 - 2024
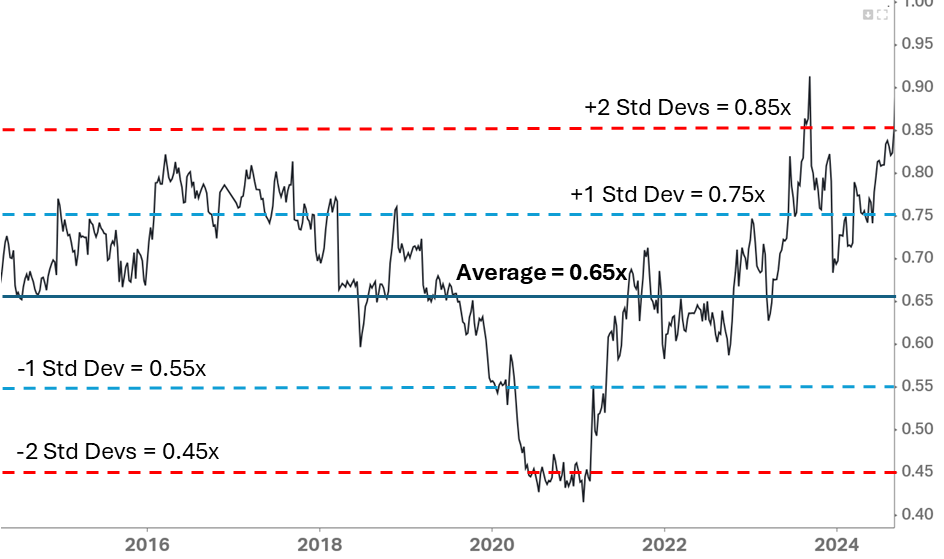
Valuation in Action: Oracle’s Re-Rating and Upside Path
By September 2024, Oracle’s P/E ratio had started to climb - a clear sign that the market was waking up to the company’s growth inflection. Yet despite this momentum, the stock still traded at a 15–20% discount to the Nasdaq 100.
That presented a compelling asymmetry.
With Oracle’s core earnings growth now projected to exceed that of the broader tech index by FY27, it was reasonable, if not conservative, to expect the P/E multiple to at least close the gap. And given that the growth acceleration was being explicitly profiled by management over a multi-year horizon, a case could be made for Oracle’s P/E to trade at a premium to the index.
At the same time, analyst earnings estimates for FY27 were still trailing management’s signals. It was clear that revisions for FY27–FY29 would have to move materially higher to align with the company’s order book and growth narrative.
The Mechanics of the Re-Rating
This is where valuation discipline meets forward-looking inference. To estimate upside, the investor must project 12 months forward. At that future point, the stock will be valued at:
Forward P/E × Forward EPS (2 years out)
So the total return comes from a compounding effect:
Upward revisions to earnings estimates, and
Expansion of the valuation multiple
For Oracle in September 2024, this pointed to a minimum 50% upside. But what followed exceeded even those expectations.
Oracle’s Outperformance and AI Supercycle
Oracle’s stock has since blown past that initial price target. A key signal: its Remaining Performance Obligations (RPO), a leading indicator of future revenue, began surging, with recent disclosures implying headline growth above 20% in FY27–FY29 on my calculations. Oracle’s latest announcement shifts this target again.
The result? Oracle’s forward multiple expanded to 35x, above Microsoft, and on par with Nvidia, signaling the market’s recognition of its new status as a key AI infrastructure player - the fourth global hyperscaler.
Then came the catalyst that lit the match yesterday:
Oracle’s $300 billion deal with OpenAI for computing power,
alongside guidance that its order backlog is on track to hit half a trillion dollars.
This unexpected announcement triggered a massive one-day rally driven not by hype, but by a clear upward reset in forward earnings expectations.
Final Thoughts: A Process for the AI Era
This has been a rapid-fire walkthrough of an investment process amplified by AI tools, using Oracle as a live case study.
The inflection was readable to any investor armed with the technques.
With AI-powered transcript search and screening, the signal was avaiable. What mattered was having a repeatable process like C.I.V.C. to:
Identify structural change,
Link it to fundamental implications,
Run the valuation, and
Pinpoint a catalyst to re-rate the stock.
Every step is now faster, more scalable, and more accessible with today’s AI capabilities. This is what The Inferential Investor is here to teach.
Hopefully this post has sparked some ideas on how you can build or sharpen your own edge using this process and AI together.
Inference never stops. Neither should you.
Andy West
The Inferential Investor
Thank you for sharing your knowledge. It’s been interesting to read you. I’m looking forward to read your book.
https://open.substack.com/pub/pramodhmallipatna/p/the-300-billion-bet-can-openai-afford